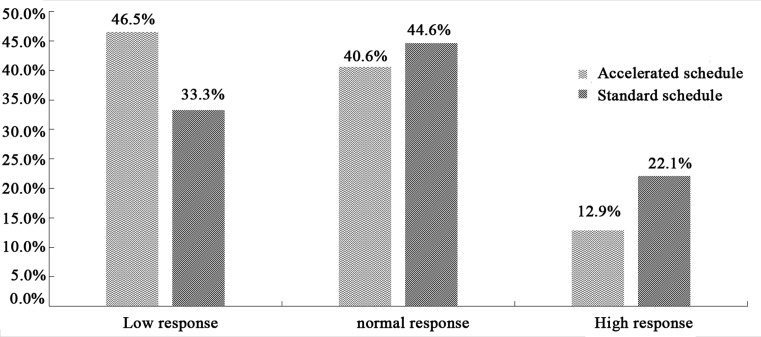
Figure 2. Anti-HBs seroconversion rates on the two vaccination schedules among subjects who produced anti-HBs.
The left vertical axis represents the constituent ratio. Wave represents the constituent ratio on accelerated schedule in each group, and slash represents the constituent ratio on standard schedule in each group. The horizontal axis represents the reaction type among subjects who produced anti-HBs.

