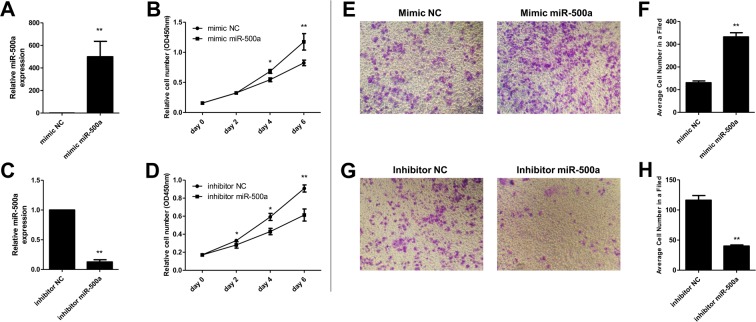
Figure 2. MiR-500a regulated the proliferation in SMMC-7721 cells.
(A,B) Transfection of mimic miR-500a increased miR-500a level, while inhibitor miR-500a decreased the level. RNA expression was measured by real-time PCR. *P<0.05 and **P<0.01, compared with mimic miR-500a group, the relative cell number in mimic NC group had a significant difference. (C,D) Transfection with mimic miR-500a accelerated SMMC-7721 cell proliferation, while inhibitor miR-500 inhibited cell proliferation. Cell proliferation was measured by CCK8 kit in after transfection with mimic or inhibitor miR-500 for 0, 2, 4, and 6 days. *P<0.05 and **P<0.01, compared with inhibitor miR-500a group, the relative cell number in inhibitor NC group had a significant difference. (E,F) Cell invasion ability was increased when transfected with mimic miR-500a in SMMC-7721 cells. (G,H) Cell invasion ability was decreased when transfected with inhibitor miR-500a in SMMC-7721 cells. Cell invasion abilities were measured by a transwell assay method after transfection for 48 h. **P<0.01, compared with the NC group, the relative or average cell number in mimic miR-500a or inhibitor miR-500a group had significant difference.

