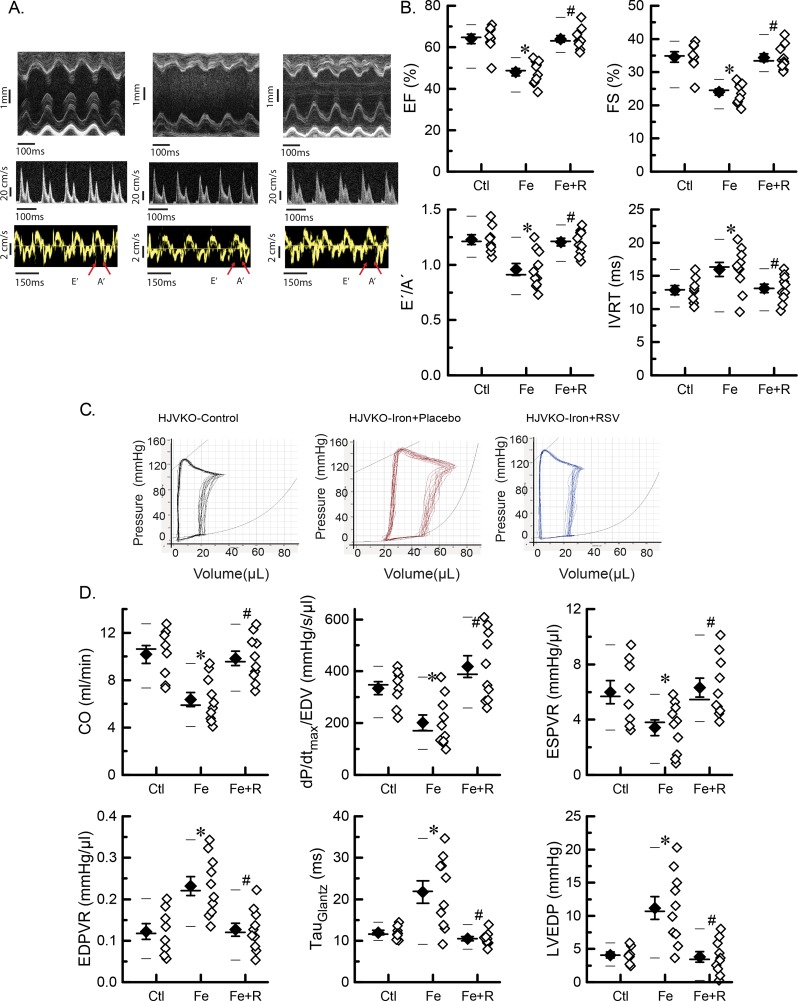
Figure 2. Cardiac function in advanced iron-overload cardiomyopathy.
(A) Representative images of M-mode (top panel), transmitral filling pattern (middle panel), and tissue Doppler (bottom panel). (B) Quantitative assessment of cardiac systolic and diastolic functions by echocardiography: EF, fractional shortening (FS), E′/A′ ratio, and isovolumic relaxation time (IVRT). (C) Representative PV loop traces. (D) Quantitative assessment of cardiac systolic and diastolic functions by PV loop analysis: cardiac output (CO), preload-adjusted contractility (dP/dtmax/EDV), end-systolic PV relationship (ESPVR), end-diastolic PV relationship (EDPVR), isovolumic relaxation constant (τ, Glantz), and LV end-diastolic pressure (LVEDP). n=8 for the control group, n=10 for the iron + placebo group, and n=10 for the iron + RSV group. *P<0.05 compared with the control group; #P<0.05 compared with the iron group. Abbreviations: Ctl, HJV control; Fe, iron diet; Fe + R, iron diet + resveratrol.

