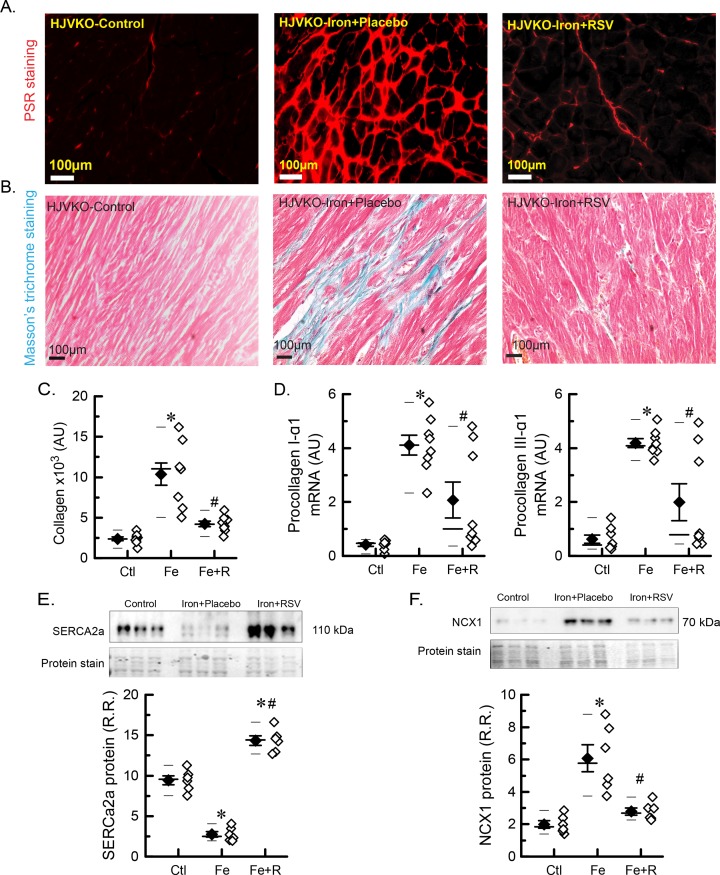
Figure 4. Myocardial fibrosis and Ca2+ cycling proteins in advanced iron-overload cardiomyopathy.
(A) Representative images of PSR staining. (B) Representative images of Masson’s trichrome staining. (C) Quantitation of PSR staining to assess fibrosis levels (n=4 hearts; two sections per heart). (D) Expression levels of myocardial procollagen Iα1 and procollagen IIIα1 (n=8 hearts). (E) Western blot analysis and quantitation of myocardial SERCa2a protein levels. (F) Western blot analysis and quantitation of myocardial NCX1 protein levels. n=6 hearts for Western blot analysis (E,F).*P<0.05 compared with the control group; #P<0.05 compared with the iron group. Abbreviations: AU, arbitrary unit; Ctl, HJV control; Fe, iron diet; Fe + R, iron diet + resveratrol; R.R., relative ratio.

