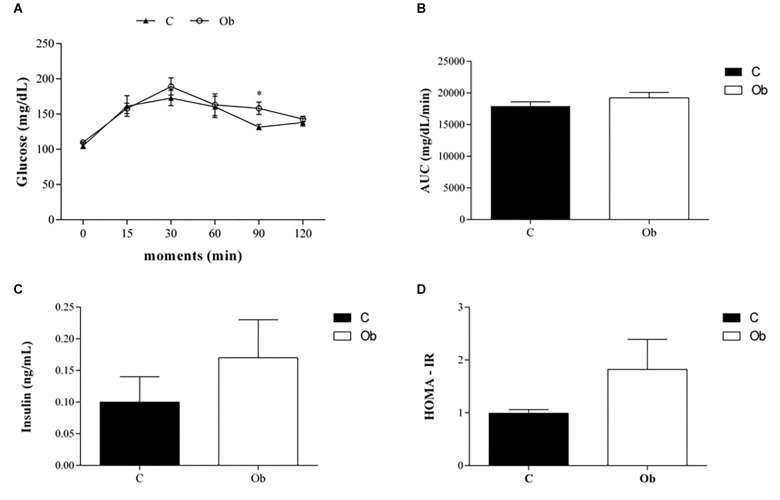
FIGURE 2.
Glucose tolerance profile at 27 week of experimental protocol of obesity. Glucose tolerance test (A), area under the curve for glucose – AUC (B), insulin serum level (C) and (D) homeostatic model assessment index (HOMA-IR) from control (C; n = 9) and obese (Ob; n = 7) groups. Data are reported as the means ± SEM. Two-way ANOVA repeated measures for independent samples followed by Tukey post hoc test. ∗p < 0.05 Ob vs. C.

