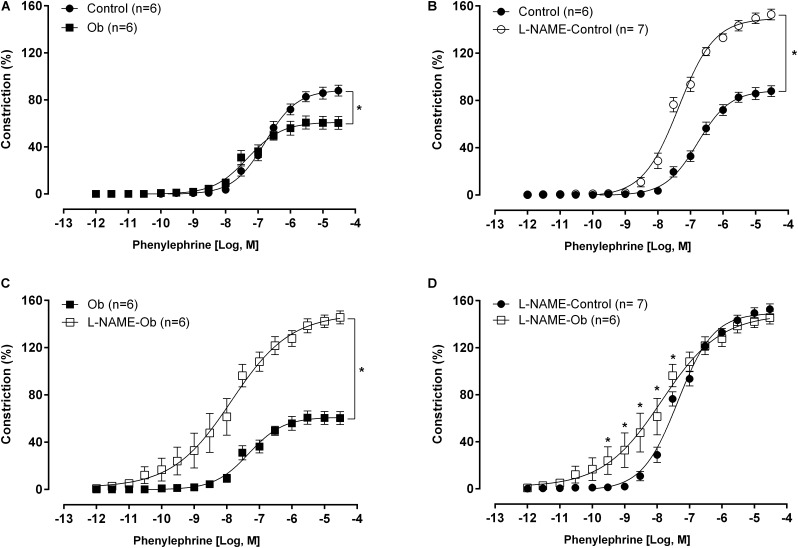
FIGURE 3.
Concentration-response curve to phenylephrine obtained from control and obese (Ob) groups rings before (A) and after nitric oxide synthase inhibition with L-NAME (100 μM – B–D). Parentheses indicates the number of rings and rats, respectively. Data are presented as the mean ± SEM. Two-way ANOVA followed by the Fisher′s post hoc test for multiple comparisons. ∗p < 0.05.

