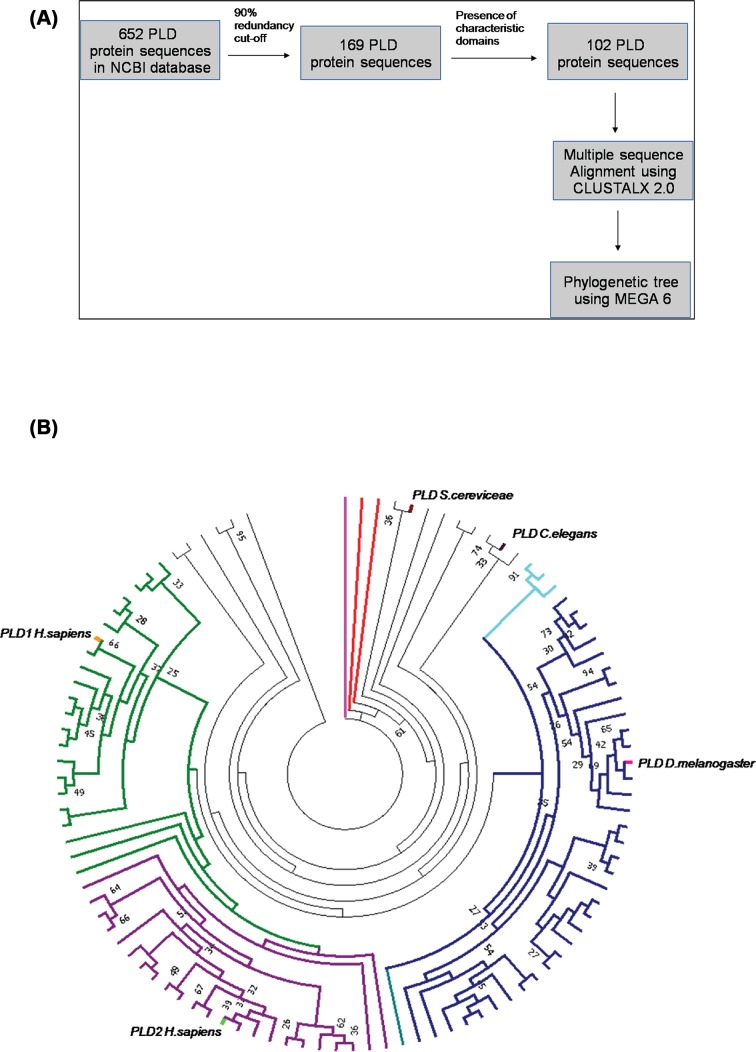
Figure 1. Phylogenetic analysis of phospholipase D sequences.
(A) Methodology – Workflow for phylogenetic analysis of PLD sequences. (B) Phylogeny of PLD sequences: the figure represents phylogenetic tree obtained using PLD protein sequences under study. The bootstrap values (>25) are marked for nodes obtained using the 50% consensus tree. The names of the taxa in clockwise order have been listed in Supplementary Table S3. Phospholipase A (PLA) sequence from Rattus novergicus has been used to root the tree (branch marked in magenta). Marked in red are PLDa and PLDb sequences from Dictyostellium fasciculatum (clockwise). PLD sequence from S. cerevisiae and C. elegans have been marked in maroon and thick black lines, respectively. The branches of the PLD sequences from class Insecta have been marked in dark blue and the PLD sequence of Drosophila melanogaster has been marked in pink. PLD sequences from class Mollusca (branches marked in cyan), PLD1 sequences from vertebrates (branches marked in green), and PLD2 sequences from vertebrates (branches marked in purple). hPLD1 and hPLD2 sequences have been labeled in orange and light green, respectively.

