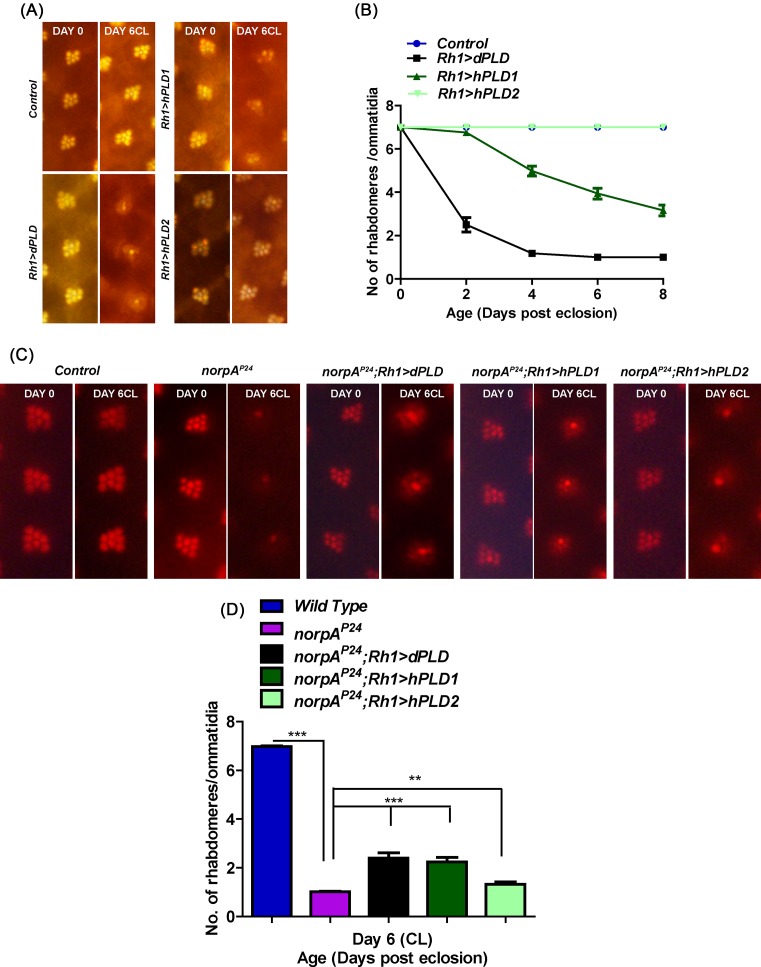
Figure 2. Functional analysis of human PLD genes in Drosophila photoreceptors.
(A) Representative optical neutralization (ON) images showing rhabdomere structure from control, Rh1 > dPLD, Rh1 > hPLD1, and Rh1 > GFP::hPLD2. The age and rearing conditions are mentioned on the top of the panels. (B) Quantitation of rate of photoreceptor (PR) degeneration of control, Rh1 > dPLD, Rh1 > hPLD1, and Rh1 > GFP::hPLD2 reared in bright light. The x-axis represents age of the flies and the y-axis represents the number of intact rhabdomeres visualized in each ommatidium. n=50 ommatidia taken from at least five separate flies. (C) Representative ON images showing rhabdomere structure from control, norpAP24, norpAP24; Rh1 > dPLD, norpAP24; Rh1 > hPLD1, and norpAP24; Rh1 > GFP::hPLD2. The age and rearing conditions are mentioned on the top of the panels. (D) Quantitation of rate of photoreceptor degeneration of control, norpAP24, norpAP24; Rh1 > dPLD, norpAP24; Rh1 > hPLD1, and norpAP24; Rh1 > GFP::hPLD2 reared in bright light for 6 days. The x-axis represents age of the flies and the y-axis represents the number of intact rhabdomeres visualized in each ommatidium. n=50 ommatidia taken from at least five separate flies. Data were tested for statistics using unpaired ttest. *** denotes P<0.001 and ** denotes P<0.01.

