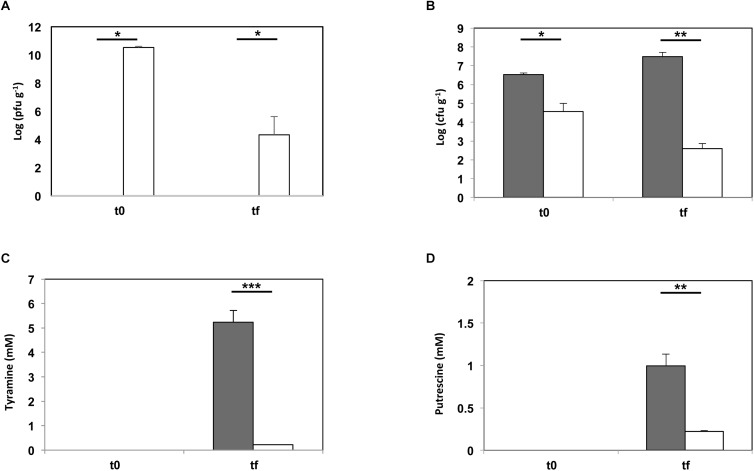
FIGURE 4.
Phage biocontrol assay in a small-scale cheese model. E. faecalis 23a was challenged with phage 156 at an MOI of 0.1 (dark gray bar = control cheeses inoculated with E. faecalis 23a; white bar = cheeses inoculated with E. faecalis 23a and challenged with phage 156). (A) Number of phage 156 particles (log pfu gr-1) after manufacturing (t0) and after 60 days of ripening (tf). (B) Number of E. faecalis cells (log cfu gr-1) after manufacturing (t0) and after 60 days of ripening (tf), as calculated by qPCR. (C) Tyramine concentration (mM) measured by UPLC after manufacturing (t0) and after 60 days of ripening (tf). (D) Putrescine concentration (mM) measured by UHPLC after manufacturing (t0) and after 60 days of ripening (tf). An asterisk indicates a significant difference (∗p < 0.05; ∗∗p < 0.01; ∗∗∗ p < 0.001;Student’s t-test) with respect to control cheeses.

