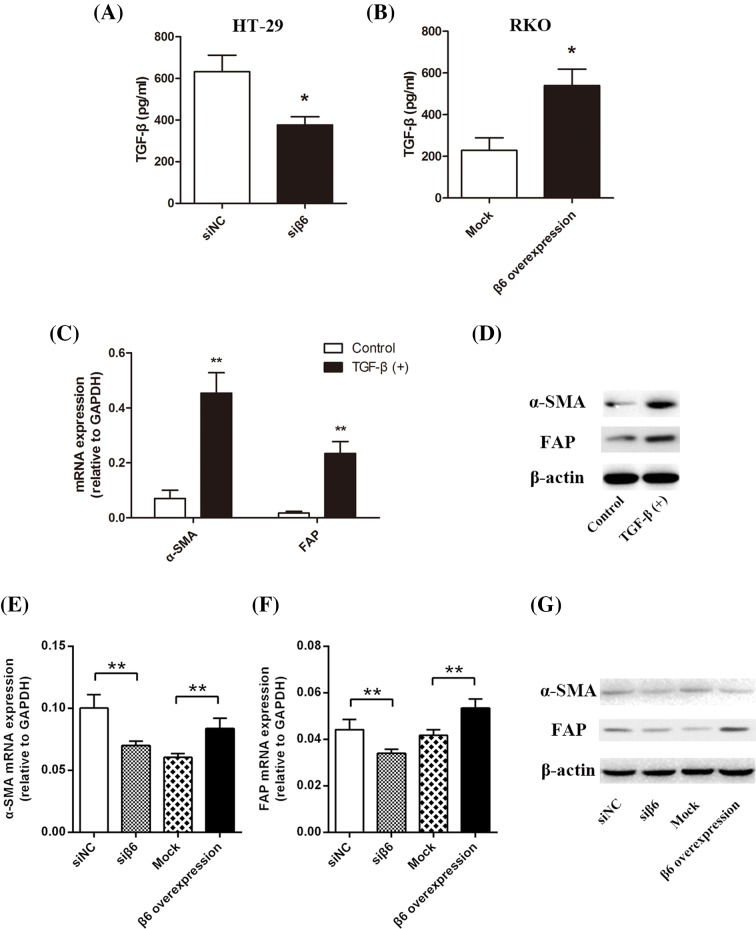
Figure 3. αvβ6 activates latent TGF-β.
(A) ELISA shows TGF-β levels in culture media collected from β6 expressing siRNA negative control HT-29 cells (siNC) and siRNA targetting β6 expression HT-29 cells (siβ6). Accompanying the decreased expression of β6, TGF-β level decreased significantly (*P<0.05). (B) ELISA show TGF-β levels in the culture media collected from mock transfected (Mock) RKO CRC cells and β6 transfected (β6 overexpression) RKO CRC cells. Accompanying the increased expression of β6, TGF-β levels increased significantly (*P<0.05). (C) RT-PCR assay shows α-SMA and FAP mRNA levels in inactive CCD-18Co fibroblasts. Accompanying the addition of exogenous TGF-β, α-SMA, and FAP mRNA levels significantly increased (**P<0.01). (D) Western blot analysis shows α-SMA and FAP protein levels in inactive CCD-18Co fibroblasts. Accompanying the addition of exogenous TGF-β, α-SMA, and FAP protein levels increased significantly. (E) RT-PCR assay shows mRNA α-SMA level in CCD-18Co fibroblasts co-cultured for 96 h with the above-mentioned four CRC cell lines. The expression of β6 was positively correlated with α-SMA mRNA levels in CCD-18Co cells. (F) RT-PCR assays show the α-SMA mRNA levels in fibroblasts CCD-18Co co-cultured for 96 h with the above-mentioned four CRC cell lines. The expression of β6 was positively correlated with FAP mRNA levels in the CCD-18Co cells. (G) Western blot analysis shows α-SMA and FAP protein levels in CCD-18Co cells co-cultured for 96 h with the above-mentioned four CRC cell lines. The expression of β6 was positively correlated with α-SMA and FAP protein expression in the CCD-18Co cells. **P<0.01, *P<0.05; data are mean ± S.E.M. from three independent experiments.

