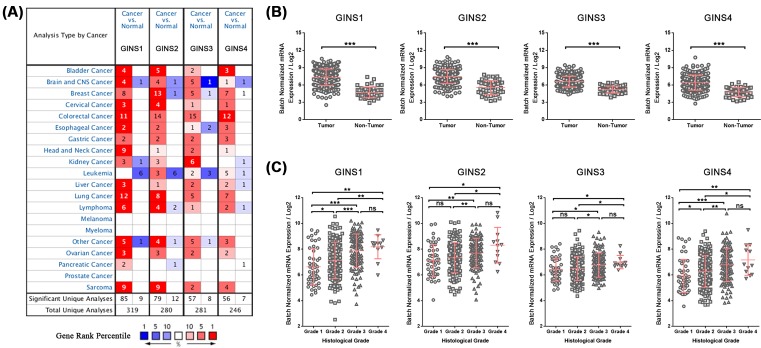
Figure 1. Expression levels of GINS subunits are significantly up-regulated in HCC.
(A) Expressions of GINS subunits (cancer compared with normal tissue) were analyzed with ONCOMINE database. The graphic demonstrated the numbers of datasets with statistically significant mRNA overexpression (red) or downexpression (blue) of the target genes. The number in each cell represents the number of analyses that meet the threshold within those analysis and cancer types. The gene rank was analyzed by percentile of target gene in the top of all genes measured in each research. Cell color is determined by the best gene rank percentile for the analyses within the cell. (B) Relative expressions of GINS subunits in HCC tumor tissues (n=373) and non-tumor liver tissues (n=50) from TCGA database. (C) Relative expressions of GINS subunits in HCC tumor tissues with different histological grades (Grade 1, n=49; Grade 2, n=166; Grade 3, n=116; Grade 4, n=12). *P<0.05; **P<0.01; ***P<0.001; ns, not significant.

