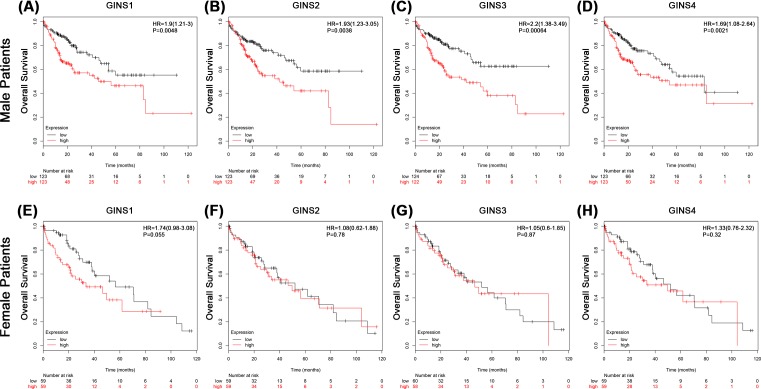
Figure 3. The associations between mRNA expression of each GINS subunit in tumor tissue and OS of male (upper panel) or female (lower panel) HCC patients.
Each mRNA expression of GINS subunit in tumor tissue was stratified into high or low expression using the median expression value as the cut-off point. Kaplan–Meier survival curves in male HCC patients for (A) GINS1 (High expression, n=123; Low expression, n=123), (B) GINS2 (High expression, n=123; Low expression, n=123), (C) GINS3 (High expression, n=124; Low expression, n=122), and (D) GINS4 (High expression, n=123; Low expression, n=123), or in female HCC patients for (E) GINS1 (High expression, n=59; Low expression, n=59), (F) GINS2 (High expression, n=59; Low expression, n=59), (G) GINS3 (High expression, n=60; Low expression, n=58), and (H) GINS4 (High expression, n=59; Low expression, n=59), and the corresponding P-value for Log-rank test were showed.

