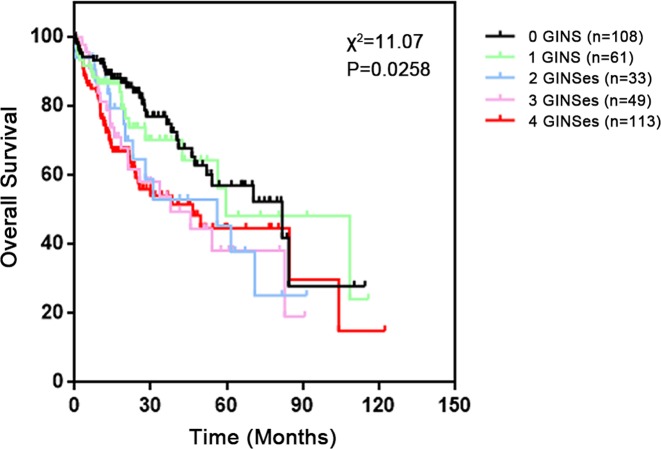
Figure 4. Survival analysis of HCC patients grouped by the number of overexpressing GINS subunits.
Kaplan–Meier survival curve for all HCC tissues stratified into five groups according to the number of overexpressing GINS subunits (0 overexpressing GINS, n=108; 1 overexpressing GINS, n=61; 2 overexpressing GINSes, n=33; 3 overexpressing GINSes, n=49; 4 overexpressing GINSes, n=113) and the corresponding P-value for Log-rank test were showed.

