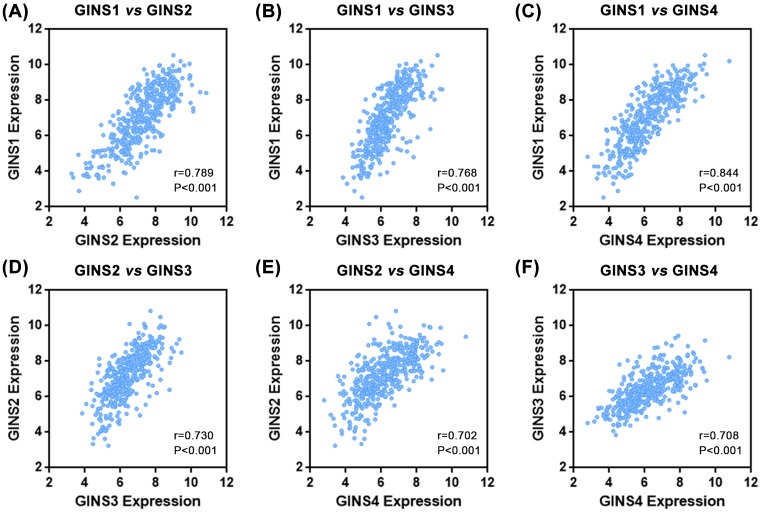
Figure 5. Expression levels of GINS subunits were highly correlated with each other.
Dot-plot graphics from analysis of cBioPortal Cancer Genomics hepatocellular carcinoma dataset (n=423) showed the correlation between GINS1 vs GINS2 (A), GINS1 vs GINS3 (B), GINS1 vs GINS4 (C), GINS2 vs GINS3 (D), GINS2 vs GINS4 (E), and GINS3 vs GINS4 (F). Insets indicated Spearman correlation scores and P-values.

