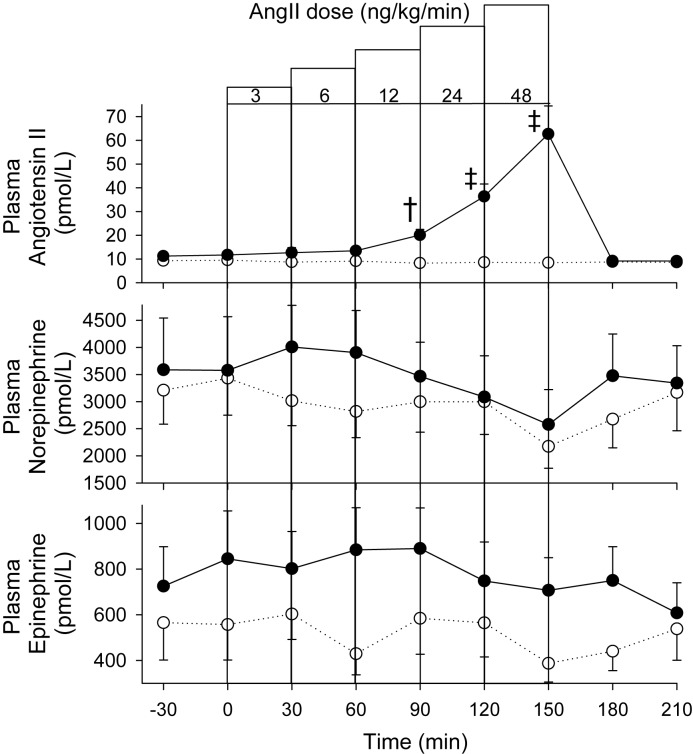
Figure 5. Plasma AngII and catecholamine levels.
Plasma Ang II, norepinephrine, and epinephrine response to incremental dose IV infusions of Ang II (●) or vehicle control (○) in eight sheep. Values shown are mean ± S.E.M. Significant differences were observed for Ang II (P<0.001). Individual time points significantly different from time-matched control (Fisher’s protected LSD from two-way ANOVA) are indicated by †P<0.01 and ‡P<0.001.

