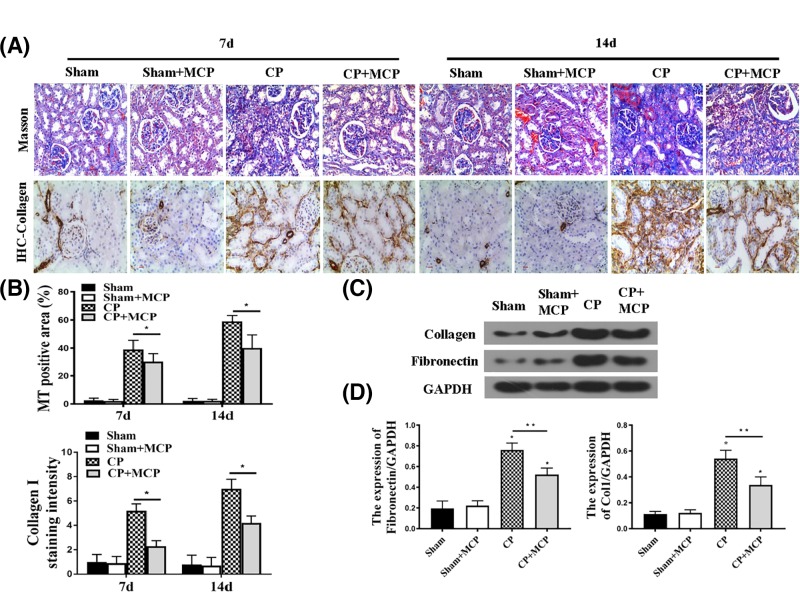
Figure 2. The effect of pharmacological inhibition of Gal-3 on tubulointerstitial injury.
(A) Masson trichrome (MT) and Sirius Red staining to assess the cumulative CP-induced toxicity for this model, some mice (n=6) were killed at 7 weeks after CP injection, and some mice (n=6) were killed at 14 weeks (CP: 20 mg/kg). (B) Representative of MT positive area (%) in each group. *P<0.05 CP vs CP+MCP; n=5. (C and D) Representative Western blot gel documents and summarized data shown the protein levels of collagen I and Fibronectin in the kidney. *P<0.05 vs sham; **P<0.05 CP vs CP+MCP, n=5.

