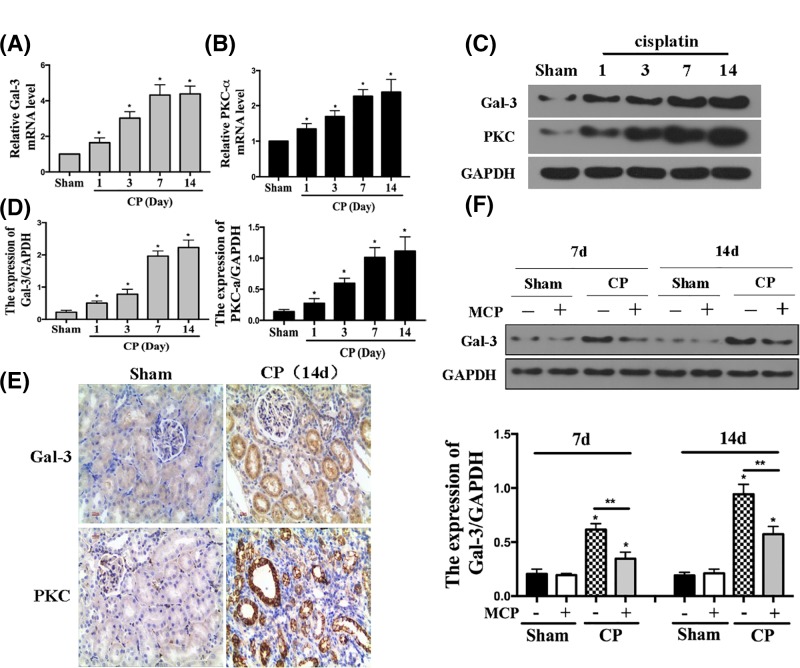
Figure 3. The expression of PKC-α and Gal-3 in the kidney after cisplatin treatment.
(A) Relative mRNA levels of Gal-3 in the kidney after CP injection. *P<0.05 vs sham, n=5. (B) Relative mRNA levels of PKC-α in the kidney after CP injection. *P<0.05 vs sham, n=5. (C and D) Representative Western blot gel documents and summarized data showing the protein levels of Gal-3 and PKC-α in the kidney. *P<0.05 vs sham, n=5. (E) Representative sections of kidney stained for Gal-3 and PKC-α from different groups of mice. (F) Representative Western blot gel documents and summarized data showing the protein levels of Gal-3 in the kidney.

