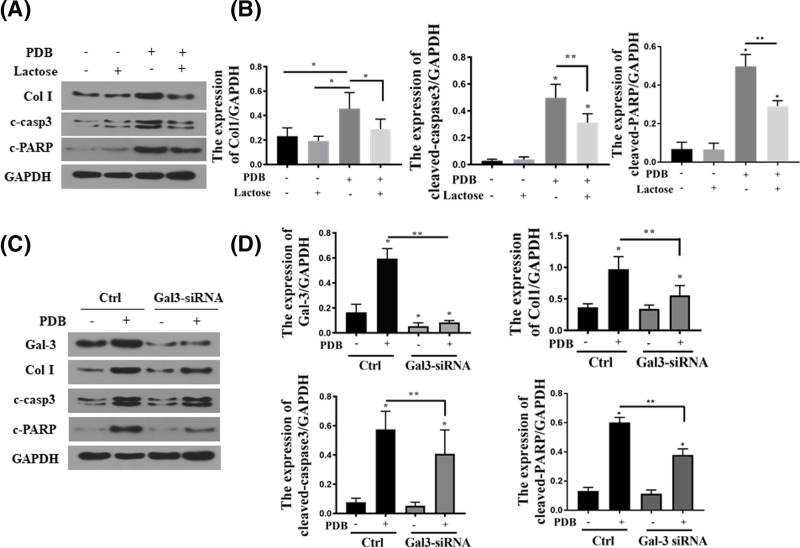
Figure 6. Block Gal-3 reduced PDB induced apoptosis and collagen I synthesis.
(A and B) The protein levels and representation of cleaved-caspase3, cleaved-PARP and collagen I in the HEK 293 cells (lactose 50 mM treated for 2 h); *P<0.05. (C and D) The protein levels and representation of gal-3, cleaved caspase-3, cleaved-PARP and collagen I in the HEK 293 cells; *P<0.05.

