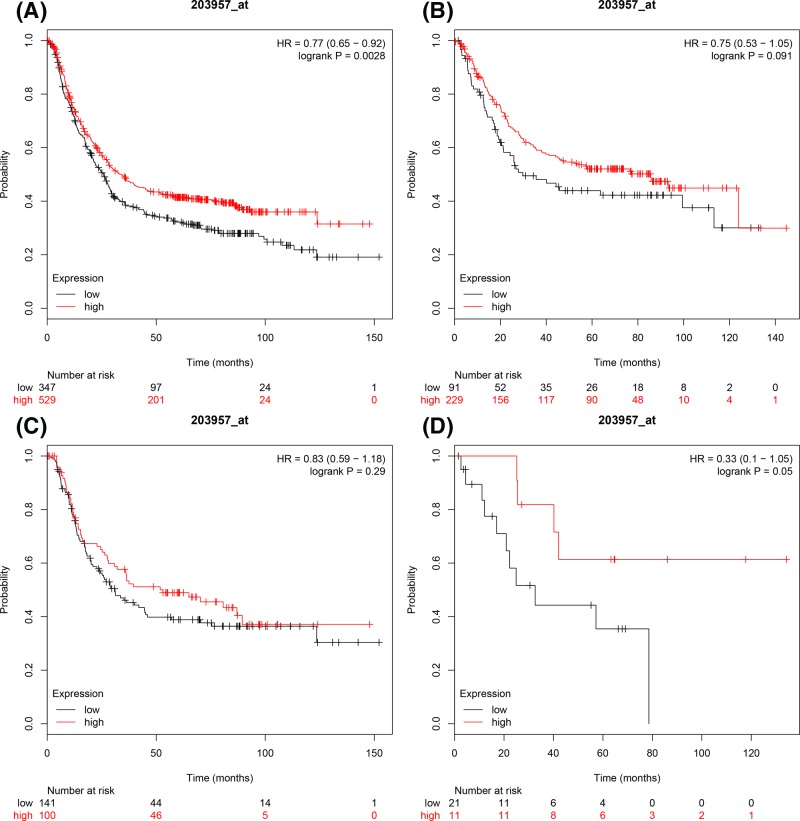
Figure 6. The prognostic values of E2F6 expression in GC.
The prognostic of E2F6 expression in www.kmplot.com ID. 203957_at. OS curves were plotted for (A) all the patients (n=876), (B) intestinal cancer patients, (C) diffuse cancer patients, (D) mixed cancer patients.

