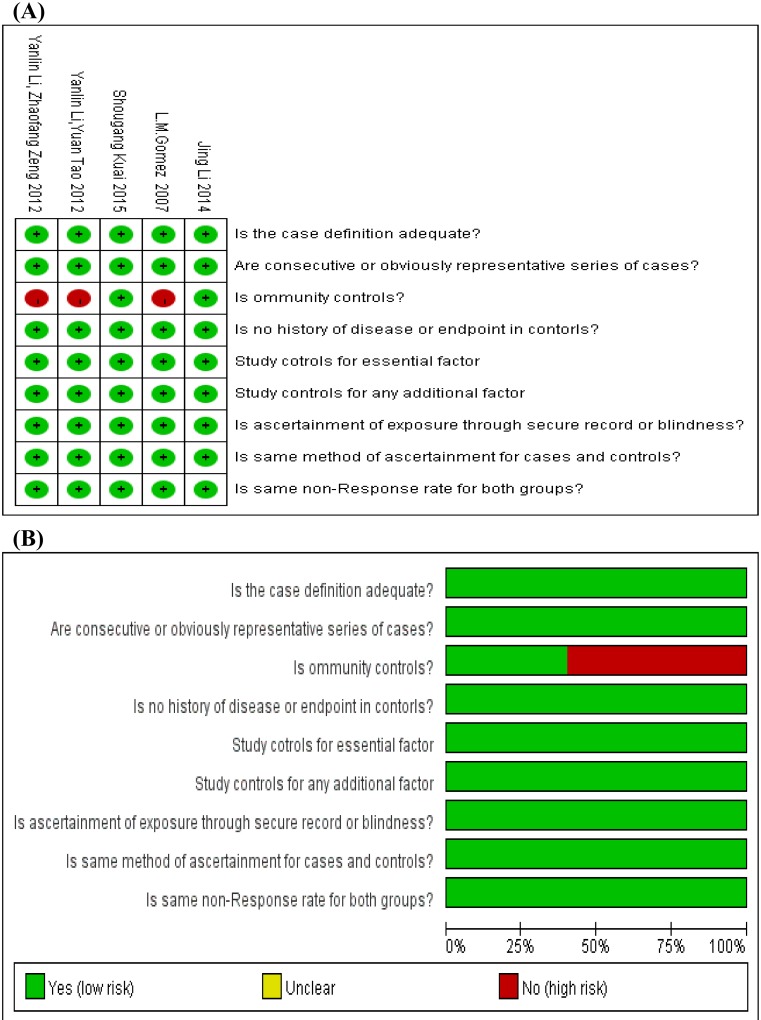
Figure 2. The details of quality assessment for each included study according to the Newcastle–Ottawa scale.
(A) The details about each risk of bias item for each included study. The red and green mean high risk and low risk, respectively for each included study. (B) The summary of each risk of bias item are presented as percentages across all included studies. The red and green mean high risk and low risk, respectively for each risk of bias item.

