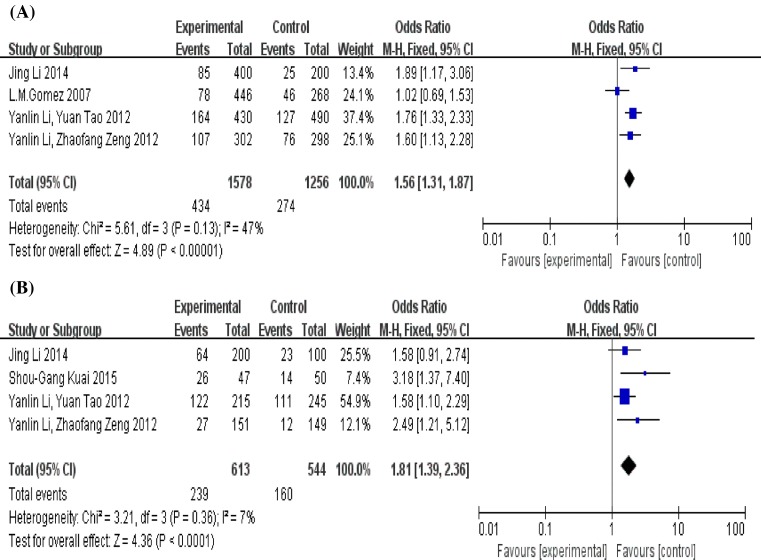
Figure 3. Forest plot of the association between the MIF-794 CATT microsatellite polymorphism and risk of TB.
(A) Alleles (7 + 8 compared with 5 + 6), (B) genotypes (7/X + 8/X compared with 5/X + 6/X). The squares and horizontal lines correspond to the study-specific OR and 95% CI, respectively. The area of the squares reflects the study-specific weight. The diamond represents the pooled results of OR and 95% CI. Overall analysis using the fixed-effect model. Abbreviations: fixed, the fixed-effect model; M–H, the method of Mantel–Haenszel.

