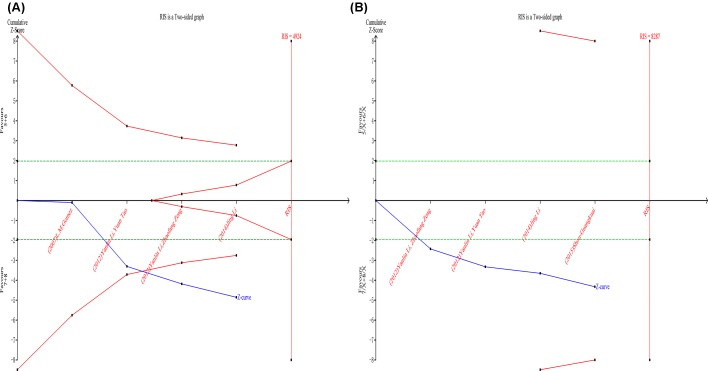
Figure 5. The results of TSA for the MIF-794CATT alleles and genotypes.
(A) Alleles, (B) genotypes. The blue solid line represents the cumulative Z-curve. The horizontal green dotted lines represent the conventional boundaries. The red lines represent the TSA boundaries. The red area arising at the right of the horizontal axis represents the futility area.

