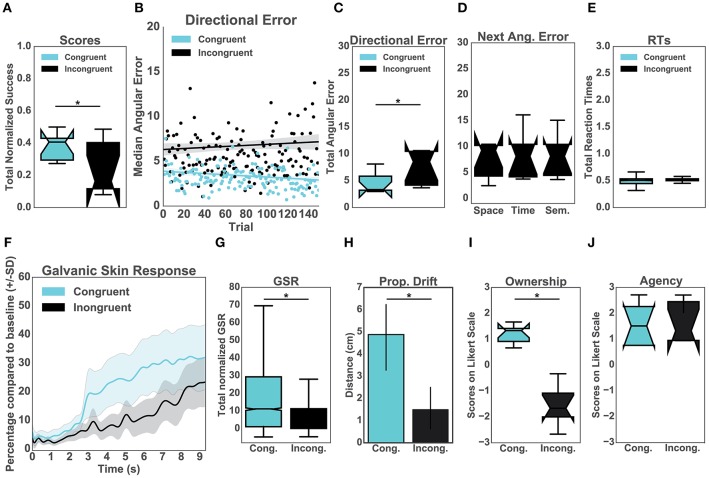
Figure 2.
Upper panel: Performance. (A) Normalized percentage of successful trials per group. (B) Median directional error per trial over the experimental block (N = 150) split per condition (C) Total directional error from all the trials per subject per condition. (D) This graph represents the mean values for the incongruent group only. In particular, the effects of the three auditory manipulations (spatial, temporal, and semantic) on the mean directional error on the consecutive trials. (E) Mean reaction times from all trials per condition. Lower panel: Body Ownership. (F) Galvanic Skin Response (GSR). The sampling rate for the GSR signal was 60 Hz. Accordingly, the data was run through a low-pass filter with a cut-off frequency of 3 Hz. The plot represents the mean GSR and the associated standard deviation for all participants in a time window of 9 s (Hägni et al., 2008), split per condition. The threatening event happened at time 0. (G) Mean GSR from 9 s post threatening event. (H) Proprioceptive drift. Results of the difference between pre- and post-test calculated in centimeters per condition. (I) Score from the self-reported experience of body ownership per group. Scores above 0 indicate ownership. (J) Score from the self-reported experience of agency per group. Scores above 0 indicate the experience of agency.

