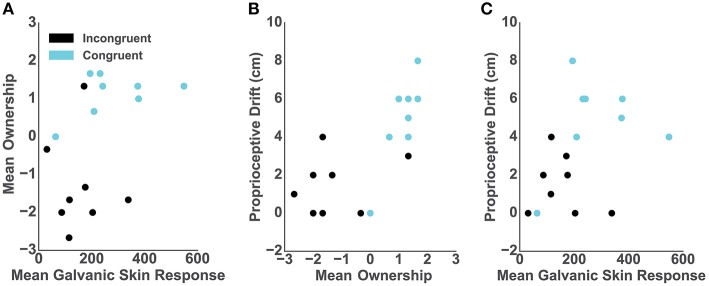
Figure 3.
Correlations. In all graphs dots represent individual participants and colors represent conditions: blue- congruent and black- incongruent. (A) Mean GSR 9 s post-threatening event and mean self-reported ownership. (B) Mean self-reported ownership and the proprioceptive drift score. (C) Mean GSR 9 s post-threatening event and the proprioceptive drift score.

