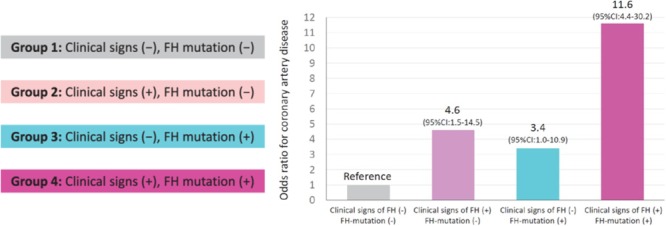
FIGURE 4.

Influence of FH, clinical signs and genetic diagnosis on the risk of CAD. Reprinted with permission from a previous study (Tada et al., 2017). The calculation of odds ratios was performed by logistic regression after adjusting for age, sex, diabetes, hypertension, smoking, and the LDL-C level. FH represents familial hypercholesterolemia; CAD represents coronary artery disease; and CI represents confidence interval (We received copyright permission from Oxford to reproduce the figure).
