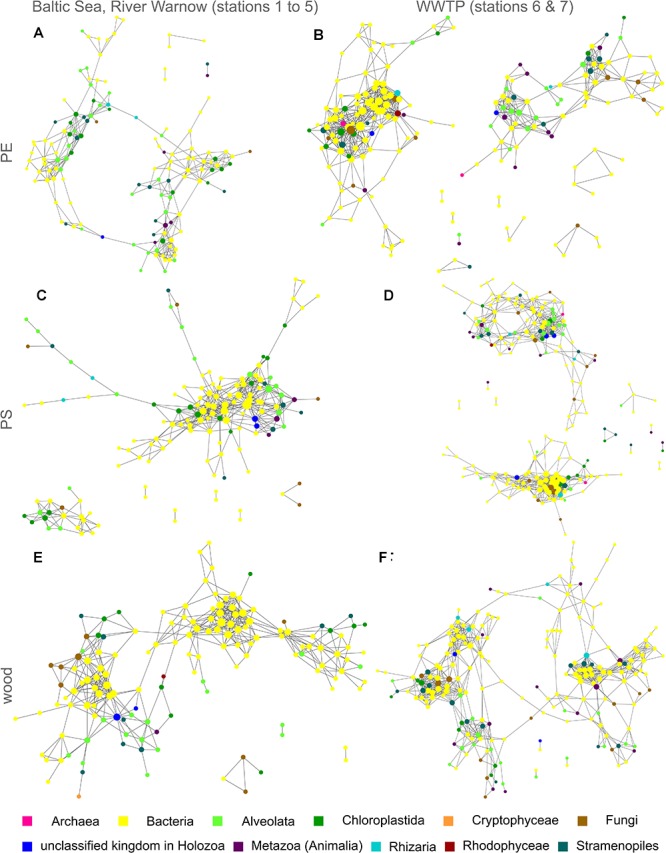
FIGURE 4.

Co-occurrence networks of prokaryotic and eukaryotic taxa for PE, PS, and wood from both incubation experiments I (Baltic Sea to River Warnow, stations 1 to 5) and II (WWTP, stations 6 and 7). Each node is a taxon and the node diameter increases with the number of direct neighbors. Edges represent significant positive correlations (p < 0.05) between nodes/taxa. Colors indicate different kingdoms. (A) PE in Baltic Sea, River Warnow (stations 1 to 5); (B) PE in WWTP (stations 6 and 7); (C) PS in Baltic Sea, River Warnow (stations 1 to 5); (D) PS in WWTP (stations 6 and 7); (E) Wood in Baltic Sea, River Warnow (stations 1 to 5); (F) Wood in WWTP (stations 6 and 7).
