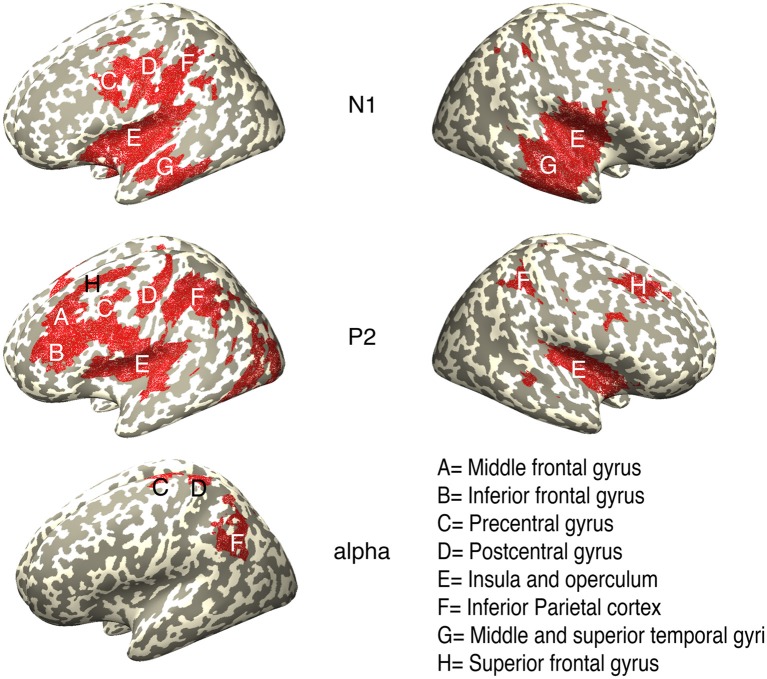
Figure 6.
Sources of the CSERP components N1 (200–250 ms), P2 (420–470 ms) and the time-frequency cluster in the alpha-band (100–240 ms/8–15 Hz) in response to pure propylene glycol stimulation analyzed by means of exact low-resolution electromagnetic tomography (eLORETA). Highlighted regions are significant clusters revealed by a cluster permutation test (p < 0.025).

