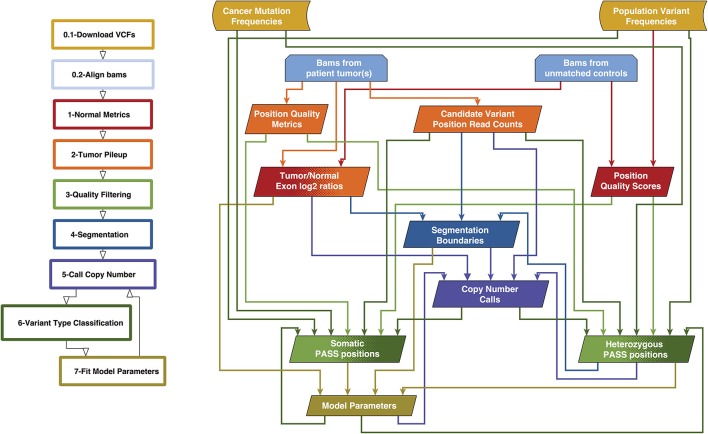
Figure 2.
Overview of lumosVar 2.0 analysis. The flow-chart on the left show the main steps in the analysis. Steps 0.1 and 0.2 are data preparation, and steps 1–7 are performed by lumosVar 2.0. The graph on the right illustrates the main inputs and outputs of each step. The color of the arrows coming from each box indicates the steps where that data is used as input, and the color of each box indicates the step where the data is generated.

