Figure 4.
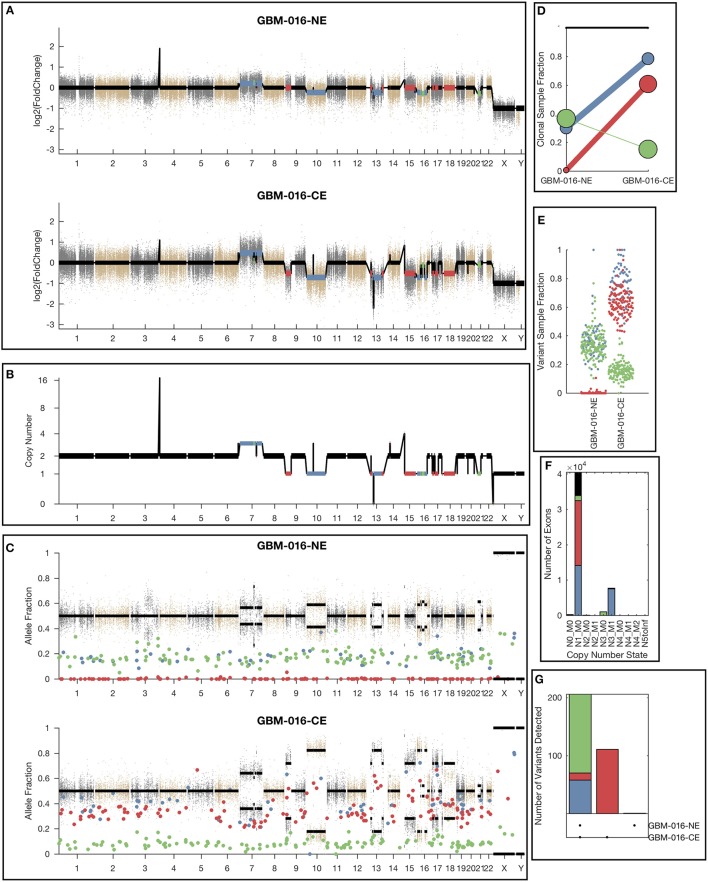
Example lumosVar 2.0 output. (A) Log2 fold change of the mean exon read depths compared to the unmatched controls. (B) The estimated integer copy number states are plotted for each genomic segment by chromosome position. (C) The variant allele fractions are plotted by chromosome position. The gray and brown dots represent variants called as germline heterozygous by lumosVar 2.0 and the large colored dots represent variants called somatic by lumosVar 2.0. (D) Summary of the clonal variant group patterns. The thickness of the lines represents the proportion of copy number events assigned to each group and the size of each circle is proportional to the number mutations assigned to each group. (E) Sample fraction (estimated proportion of cells in the sample containing the variant) distribution of somatic mutations. (F) Number of exons determined to be in each copy number state, excluding diploid. (G) Number of somatic mutations detected in both samples (left bar), enhancing only (middle bar), and non-enhancing only (right bar). On all plots, the colors indicate the clonal variant group.

