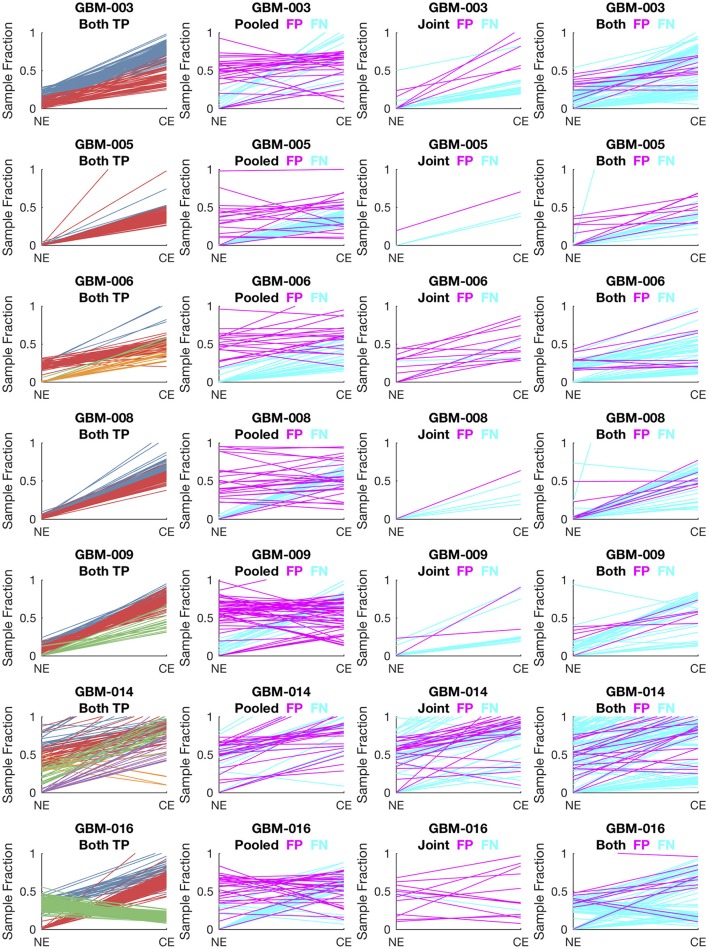
Figure 5.
Comparison of variants called in pooled vs. joint approach. The first column of graphs shows the estimated sample fractions of true somatic variants that were detected by both the pooled and joint approaches. The variants are colored by clonal variant groups. The other three columns show the sample fractions of variants that were called incorrectly only in the pooled approach (column 2), only in the joint approach (column 3), or incorrectly in both approaches (column 4). False positives variants are shown in magenta and false negatives in cyan.

