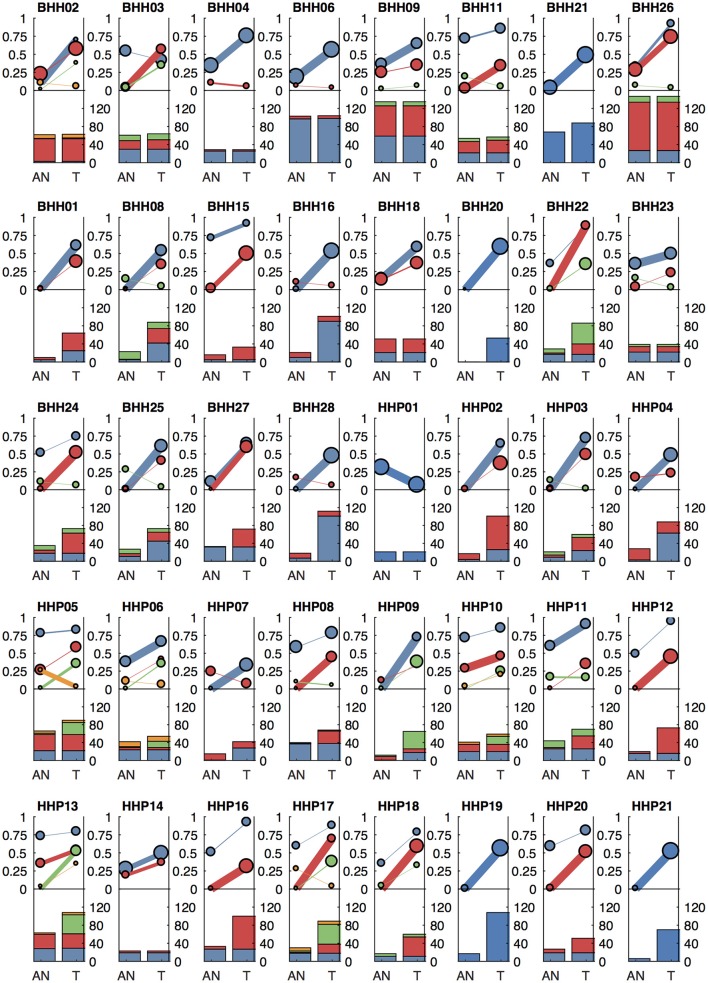
Figure 6.
Clonal patterns and variant counts detected by lumosVar 2.0 in the archival dataset. The top half of each plot shows the summary of the clonal variant group patterns for each patient. Each line represents a clonal variant group and the thickness of the lines represents the proportion of copy number events assigned to each group and the size of each circle is proportional to the number mutations assigned to each group. The bottom half of each plot shows the number of somatic variants detected in the adjacent normal (AN) and tumor (T) samples, with the colors corresponding the clonal variant groups. The 8 patients in the top row had the adjacent normal tissue macrodissected from tumor containing slides and these patients typically have similar number of variants detected in the tumor and adjacent normal.

