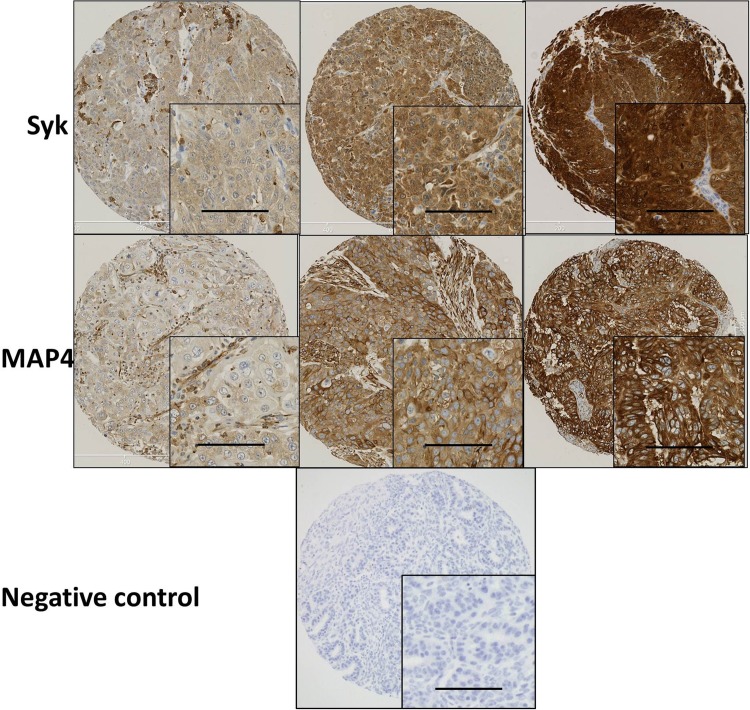
Fig. 1.
Representative photomicrographs of Syk and MAP4 expression in ovarian carcinoma cells. Expression levels, including low (left), medium (middle) and high (right) staining, of Syk and MAP4 at × 10 magnification with × 20 magnification inset panel. Negative controls omitted primary antibody. Scale bar represents 100 µm

