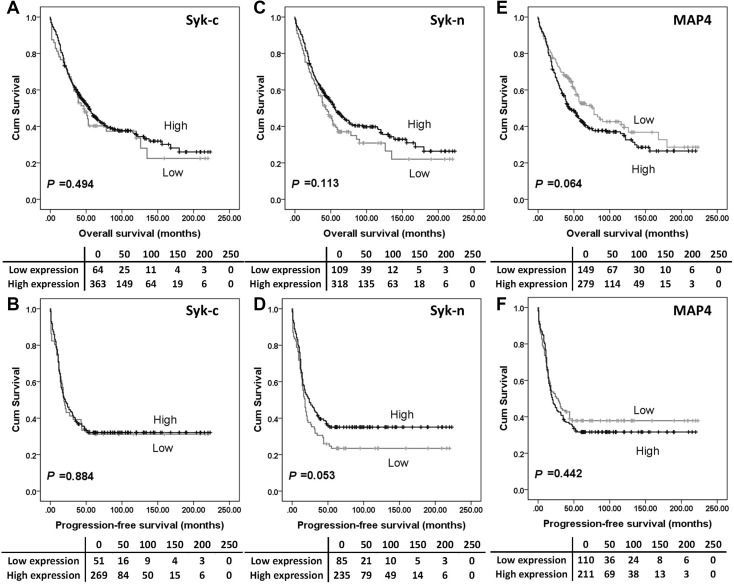
Fig. 2.
Kaplan–Meier survival curves show the impact of Syk-c, Syk-n and MAP4 expression on overall survival and progression-free survival. There were no differences in survival between patients with tumours expressing high MAP4 or Syk and those with tumours expressing low MAP4 or Syk. Significance was determined using the log-rank test. The tables shown below the Kaplan–Meier survival curves listed the number of patients at risk at the specific months. High expression—black line, low expression—grey line

