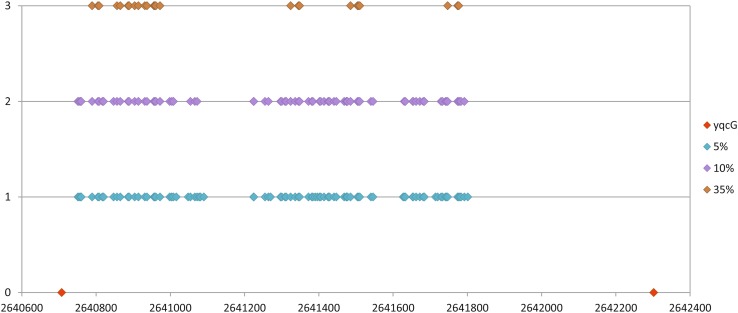
Fig. 6.
The frequency and distribution by positions of SNPs within the yqcG gene in the cell population of the SZMC 6179J strain, as revealed by three distinct scans in the aligned reads with different sensitivity (5, 20 and 35%). The symbols on the x axis show the positions of the start and stop codons of the yqcG gene

