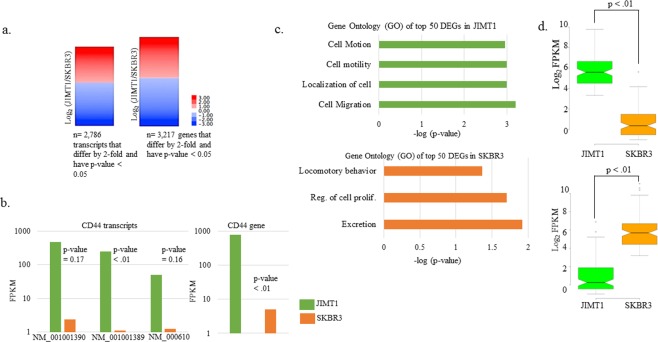
Figure 1.
RNA-seq results and Gene Ontology (GO) in top DEGs. (a) DETs and DEGs log2 ratios of (Fragments Per Kilobase of transcript per Million mapped reads) FPKMs (JIMT1/SKBR3) meeting indicated criteria. Statistical testing was conducted by Cufflinks. (b) Three CD44 DETs that were DE at least 2-fold in JIMT1 relative to SKBR3 cells and their associated p-values as reported by Cufflinks for replicates. CD44 DE in JIMT1 and SKBR3 cells. (c) Gene ontology (GO) terms for top DE genes determined by DAVID15. Only p-values (as reported by DAVID) less than 0.05 are shown. (d) Two-tailed t-test of top-50 genes shown in (c) for each cell line.

