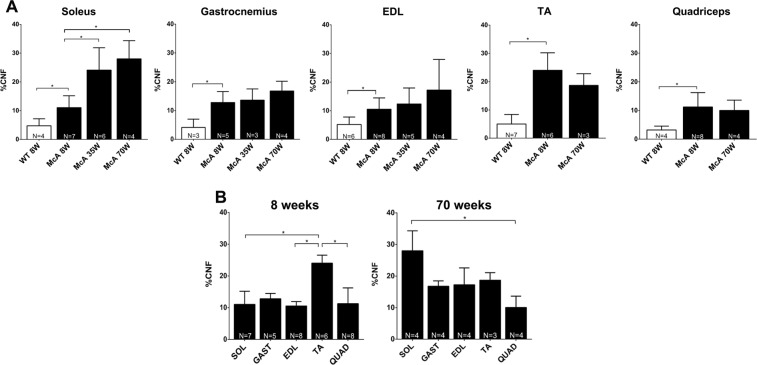
Figure 4.
Quantification of centrally nucleated fibers (CNF) among the different muscles and ages. (A) Percentage of CNF from the total amount of fibers. White columns correspond to wild-type (WT) mice whereas black columns correspond to McArdle (McA) mice. Only WT values from 8 wo mice are shown, as values WT values are similar among the three different ages. Each column represents the percentage of CNF resulting from the mean value obtained from 3 to 8 mice. The total number of mice used (N) is indicated at the bottom of each column. In each column between 491 (minimum) and 5,079 (maximum) fibers were counted (median 1682 fibers). Error bars correspond to standard deviation (SD). (B) Percentage of CNF in the different muscles of 8 and 70-week-old McA mice. For each age, muscles are represented together. Error bars correspond to SD. The non-parametric Kruskal-Wallis One-Way ANOVA with multiple comparisons test (Dunn’s test) was used for statistical analyses. Symbols: *p < 0.05.

