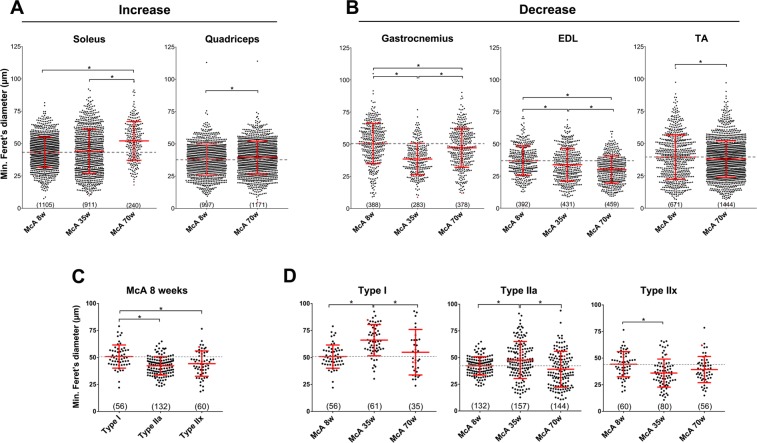
Figure 7.
Fiber size determination using the minimum Feret diameter (mFd). (A) Fiber size increase in soleus and quadriceps between 8 and 70-week-old McA mice. (B) Fiber size decrease in gastrocnemius, EDL and TA between 8 and 70-week-old McA mice. (C) Type I, IIa and IIx soleus fiber size from 8-week-old McA mice. (C) Type I soleus fiber size increase and IIa and IIx fiber size decrease between 8 and 70-week-old McA mice. Data is represented as a Scatter Plot. Each dot represents the mFd of a single fiber. A grey dot-line indicates the mean value of McA 8-week-old mice in each muscle. For each plot the mean value and the SD are also indicated in red. Below each plot is indicated the total amount of fibers (between brackets) counted. Between 3 to 5 mice were used in each column. One-Way ANOVA with post-hoc Tukey Honestly Significant Difference (HSD) test was used for statistical analyses. Symbols: *p < 0.05.

