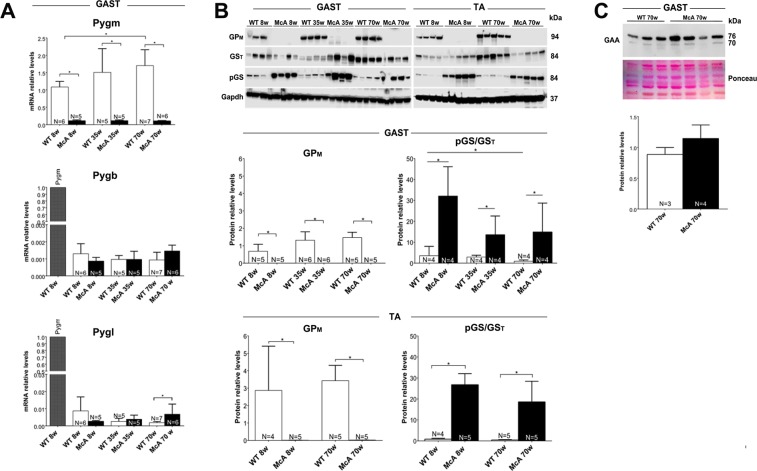
Figure 9.
Expression studies of genes involved in glycogen synthesis and degradation. (A) Quantitative PCR analysis of the different glycogen phosphorylase isoforms in the gastrocnemius muscle. In the Pygb and Pygl studies, the relative Pygm expression values in one gastrocnemius muscle is shown. (B) Western blot analysis of GPM, total GS (GST) and phospho serine 641 GS (pGSSer 641) in gastrocnemius and tibialis anterior (TA) muscles. Glyceraldehyde-3-Phosphate Dehydrogenase (Gapdh) was used as a loading control. The blot images were obtained with Fujifilm LAS 3000 imager. These are cropped images. Uncropped original images can be found in Supplementary Fig. 5. The relative quantification for GPM protein results from GPM/Gapdh ratio after image J quantification as well as the relative quantification of the phosphorylated fraction of (inactive) GS protein. This quantification results from pGS/GST ratio after image J quantification. (C) Alpha acid glucosidase protein levels in 70 wo WT and McA mice determined by western blot. Ponceau staining was used for loading normalization. Error bars correspond to standard deviation (SD). The non-parametric Kruskal-Wallis One-Way ANOVA with multiple comparisons test (Dunn’s test) was used for statistical analyses. Symbols: *p < 0.05.

