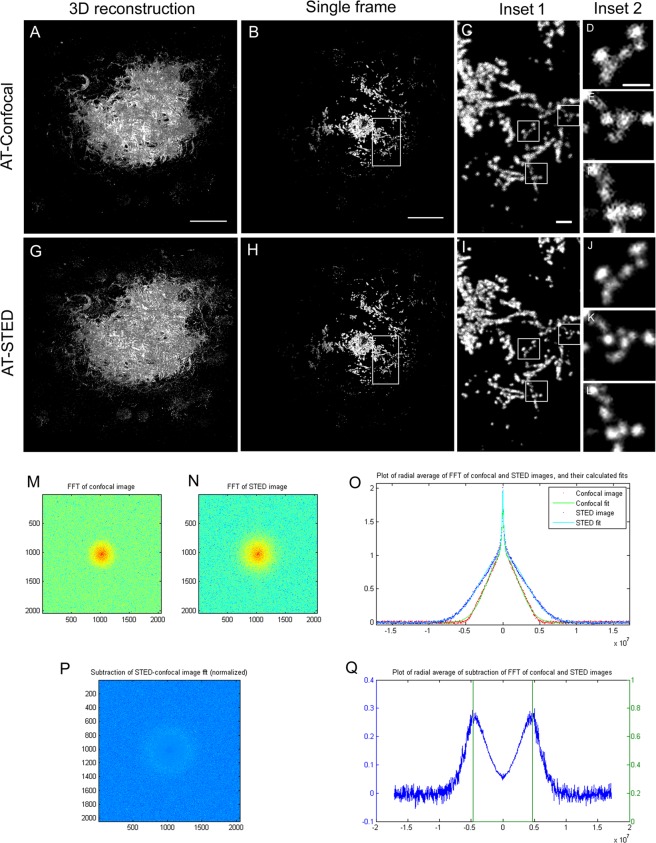
Figure 2.
Comparison of the resolution between AT-Confocal and AT-STED modalities. (A,G) Maximal projection of a 3D reconstruction of an amyloid beta plaque in AT-Confocal and AT-STED respectively. (B,H) Image of a single slice of the amyloid-β plaque. (C–F; I–L) insets. (M,N) Scale bar = 10 µm, 1 µm for inset 1 and 0,5 µm for inset 2. Frequency domain representation of B and H. (O) Radial average of the frequency information for the AT-Confocal and AT-STED cases. (P,Q) Difference between of the radial frequency information between modalities. Green lines show the theoretical diffraction limit for 1.4NA objective.

