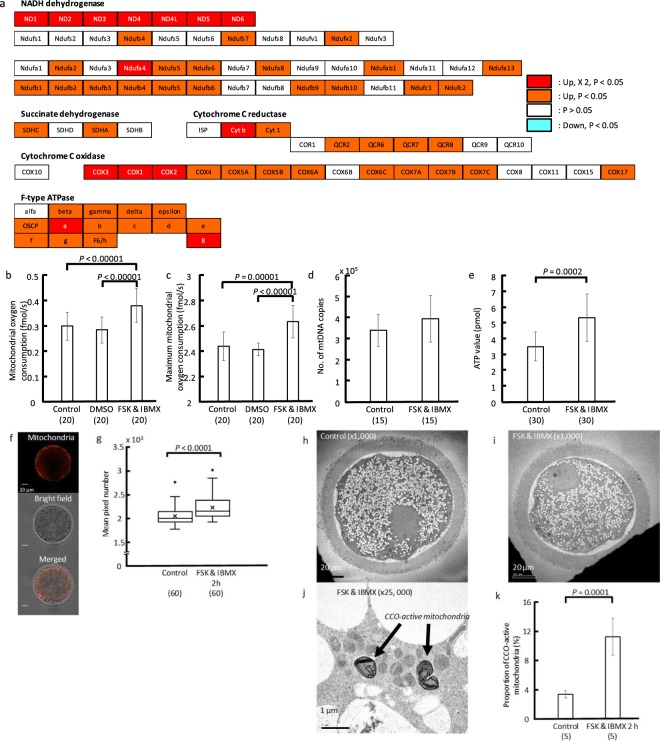
Figure 2.
Change of expression of genes involved in mitochondrial function in oocytes following FSK and IBMX treatment. (a) Each box shows the protein constituents of mitochondrial complex, NADH dehydrogenase, succinate dehydrogenase, cytochrome C reductase, cytochrome C oxidase, and ATPase. Red and orange boxes indicate that gene expression is significantly upregulated (P < 0.05). White and blue boxes show that gene expression is unchanged and downregulated, respectively. Red box also means that the expression level is increased more than double in oocytes after FSK and IBMX treatment compared with control oocytes. This was produced in reference to KEGG pathway for oxidative phosphorylation in Bos Taurus (https://www.genome.jp/kegg-bin/show_pathway?org_name=bta&mapno=00190&mapscale=&show_description=show). (b) Bar chart shows the oxygen consumption in mitochondria in oocytes following FSK and IBMX treatment for 2 h. Mitochondrial oxygen consumption significantly increased upon FSK and IBMX treatment (P < 0.00001). (c) Bar chart shows the maximum oxygen consumption in mitochondria in oocytes following FSK and IBMX treatment for 2 h. Maximum mitochondrial oxygen consumption significantly increased upon FSK and IBMX treatment (P < 0.0001). (d) Bar chart shows the mitochondrial DNA (mtDNA) copy number in oocytes following FSK and IBMX treatment for 2 h, as determined using real-time PCR. The copy number of mtDNA in oocytes did not change. (e) Bar chart shows ATP levels in oocytes following FSK and IBMX treatment for 2 h, measured as luminescence generated in an ATP-dependent luciferin–luciferase bioluminescence assay. ATP level in oocytes significantly increased after treatment (P < 0.001). (f) Representative image of MitoTracker-stained oocyte. (g) The boxplot shows active mitochondria in oocytes (mean pixel number). FSK and IBMX treatment significantly increased active mitochondria in oocytes (P < 0.0001). Parentheses show the numbers of oocytes examined. Data were compared using t-test. (h–j) Representative ultrastructures in oocytes before and after FSK and IBMX treatment. (h,i): x1,000; (j): x25,000. Black arrows show mitochondria with cytochrome C oxidase activity. (k) Bar chart shows the proportion of mitochondria with cytochrome C oxidase activity in oocytes following FSK and IBMX treatment for 2 h. FSK and IBMX treatment significantly increased the proportion of mitochondria with cytochrome C oxidase activity (P < 0.001). Parentheses show the numbers of oocytes examined. Data in 2b and c were obtained from the same samples. Oxygen consumption was measured using scanning electrochemical microscopy. Data were compared by t-test or ANOVA followed by the Tukey–Kramer test.

