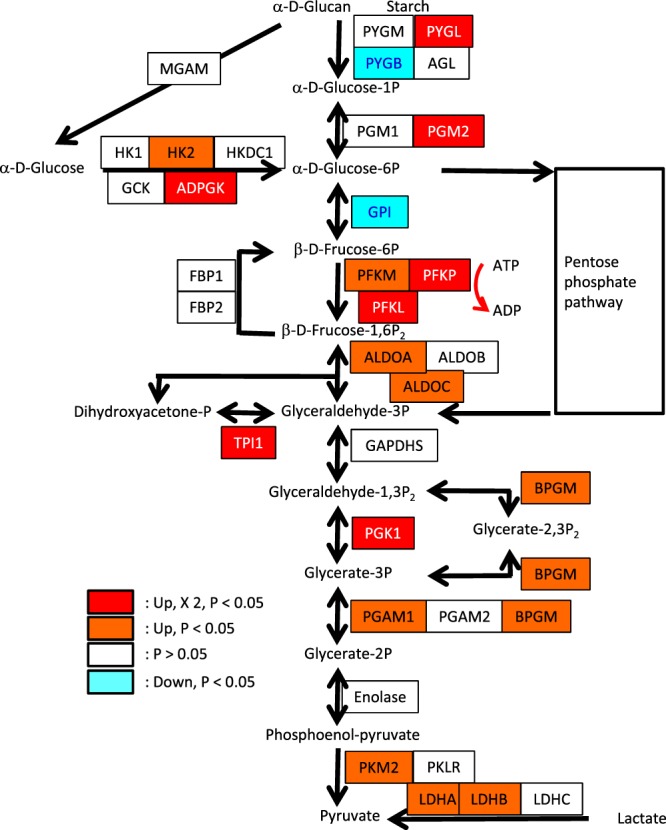
Figure 4.

Schema of expression of genes involved in glycolysis in oocytes following FSK and IBMX treatment. Each box shows enzymes involved in glycolysis. Red and orange boxes indicate that gene expression is significantly upregulated (P < 0.05). White and blue boxes show that gene expression is unchanged and downregulated, respectively. Red box also means that the expression level is increased more than double in oocytes after FSK and IBMX treatment compared with control oocytes. PYGL, PYGM, and PYGB: glycogen phosphorylases; AGL: glycogen debranching enzyme; MGAM: maltase-glucoamylase; PGM1: phosphoglucomutase-1; PGM2: phosphoglucomutase-2; HK1, HK2, and HKDC1: hexokinases; GCK: glucokinase; ADPGK: ADP-dependent glucokinase; GPI: glucose-6-phosphate isomerase; PFKM, PFKL, and PFKP: 6-phosphofructokinases 1; FBP1 and FBP2: fructose-1,6-bisphosphatases I; ALDOA, ALDOB, and ALDOC: fructose-bisphosphate aldolases, class I; GAPDH: glyceraldehyde 3-phosphate dehydrogenase; BPGM: bisphosphoglycerate/phosphoglycerate mutase; PGK1: phosphoglycerate kinase; PGAM1 and PAM2: 2,3-bisphosphoglycerate-dependent phosphoglycerate mutases; TPI1: triosephosphate isomerase; PKM: pyruvate kinase; PKLR: pyruvate kinase isozymes R/L; LDHA, LDHB: lactate dehydrogenase. HK2, ADPGK, PFKL, PFKM, PFKP, ALDOA, ALDOC, and PKM2 are rate-limiting enzymes in the glycolytic system.
