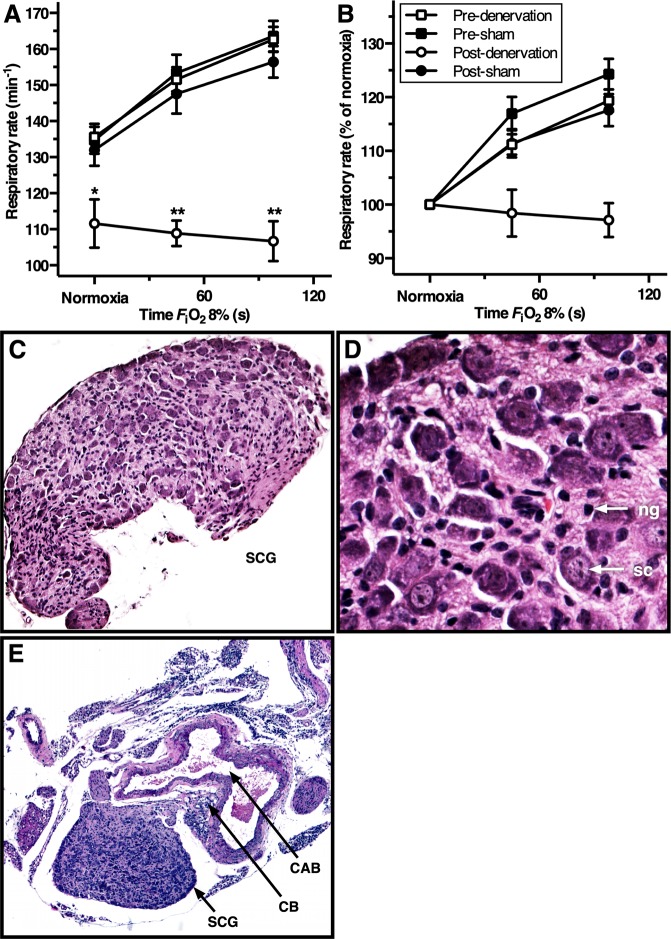
Figure 4.
HVR and histological confirmation of CB denervation. (A) Mean ± SEM respiratory rate (RR) and (B) mean ± SEM RR normalized to normoxia and expressed as a function of hypoxia time (FiO2 of 8%, from 0–100 s) for the animals in the denervation and sham group before and after the surgical procedure. Statistically significant differences per time point of hypoxia exposure were found in post-denervation vs. others (*P < 0.01; **P < 0.001). One-way repeated measurements ANOVA on normoxia-normalized RR values of the denervation group yielded a procedure effect, time effect, and interaction between both (P < 0.001, P < 0.05 and P < 0.01, respectively), whereas the same test in the sham group only found a time effect (P < 0.001). In the sham group a procedure effect and interaction were absent (P = 0.537 and P = 0.811, respectively). (C–E) Hematoxylin-eosin (HE)-stained histology images (100×, 400×, and 50× magnification, respectively) showing the SCG neuroglia cells (ng), satellite cells (sc), CB, and the carotid arterial bifurcation (CAB). The SCG depicted in panels C and D was obtained from the denervation group, whereas the tissue depicted in panel E was obtained from an animal from the sham group.

