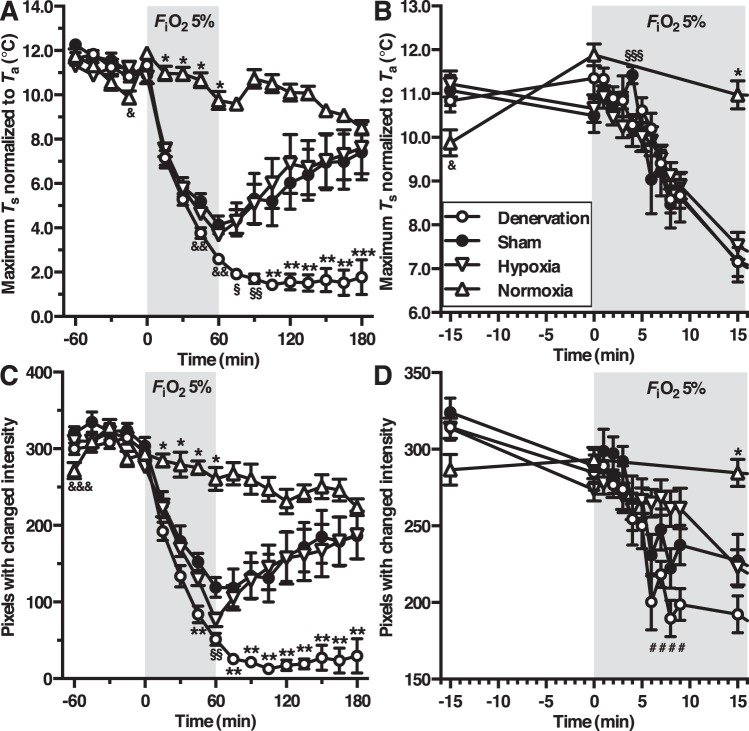
Figure 5.
Body temperature (A,B) and locomotor activity (C,D) during hypoxia-induced anapyrexia. The legend is provided in panel B. Group and statistical test indices are depicted as following: normoxia vs. other groups (*P < 0.001), denervation vs. other groups (**P < 0.001, or ***P < 0.01), normoxia vs. hypoxia (&P < 0.05), normoxia vs. sham and denervation (§P < 0.001), denervation vs. sham and normoxia (§§P < 0.001), sham vs. hypoxia (§§§P < 0.05), sham vs. denervation (&& P < 0.001), normoxia vs. sham and hypoxia (&&& P < 0.01), and denervation vs. hypoxia (#P < 0.05).

