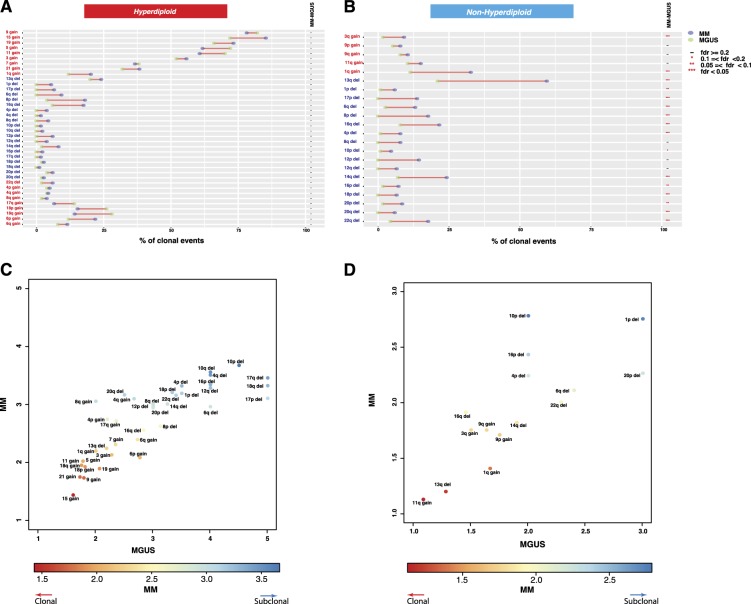
Fig. 4. Clonality indices of copy number events in MGUS and MM.
a, b Comparison of clonal CNA frequencies between MGUS and MM for HMM (a) and NHMM (b). Rows represent chromosome arms and are in the same order in Fig. 2. The frequencies of events in MGUS and MM are represented by green and purple circles, respectively. Adjusted significance levels for each comparison (FDR) are given in the rightmost columns. c, d 2D scatterplots of the clonality index, computed as the mean clonality score when the alteration is detected. The score is between one and five, with one being clonal and five being low subclonal. Each point represents a chromosome arm event. Axes represent stages: MGUS (x-axis) and MM (y-axis). We present separate scatterplots for hyperdiploid (c) and nonhyperdiploid (d) samples

