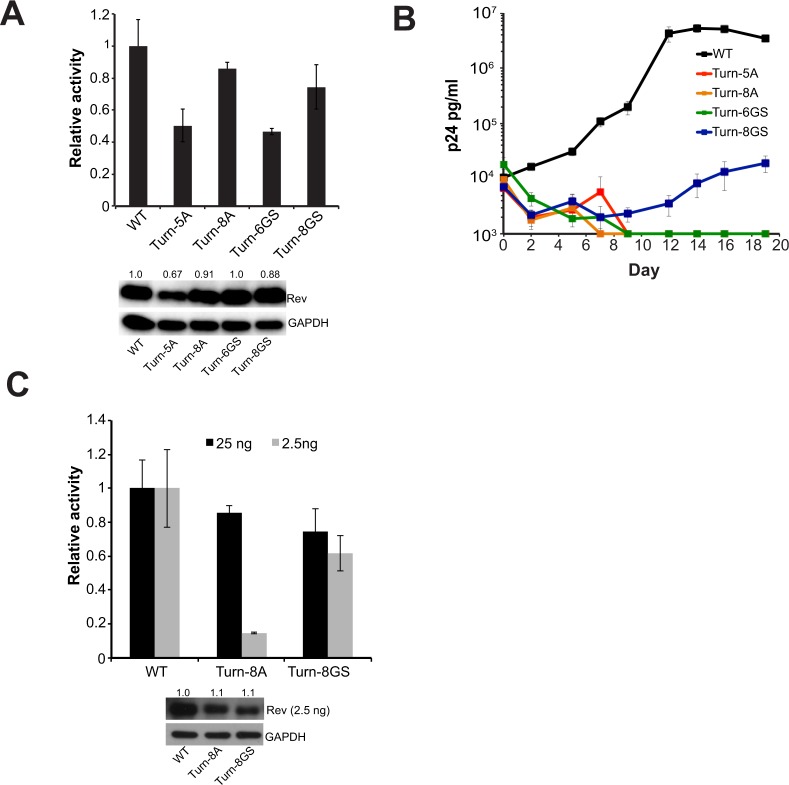
Figure 6.
The turn plays an intriguing role in Rev function (A) Reporter assay monitoring function of Rev constructs with mass substitution of turn residues 26–33. Data are mean ± standard deviation (s.d) of biological replicates. Western blots below show protein expression for Strep-tagged Rev and GAPDH as loading control. Numbers above blots represent quantified band intensities for Rev mutants relative to WT-Rev. The Turn-5A mutant shows reduced Rev expression suggesting that it might be less stable than the other mutants. (B) Corresponding viral replication spread experiments. Viral p24 levels below 1000 pg/ml are shown as 1000 pg/ml in the plots for illustration purposes. Data are mean ± s.d of biological triplicates. (C) Reporter assay monitoring export activity at 25 ng and 2.5 ng of transfected Rev plasmid. Western blots below showing protein expression for Strep-tagged Rev (at 2.5 ng only) and GAPDH as loading control. Data are mean ± standard deviation (s.d) of biological replicates and numbers above blots represent quantified band intensities for Rev mutants relative to WT-Rev. Export activity for both quantities of transfected Rev before normalization are shown in Fig. S3.

