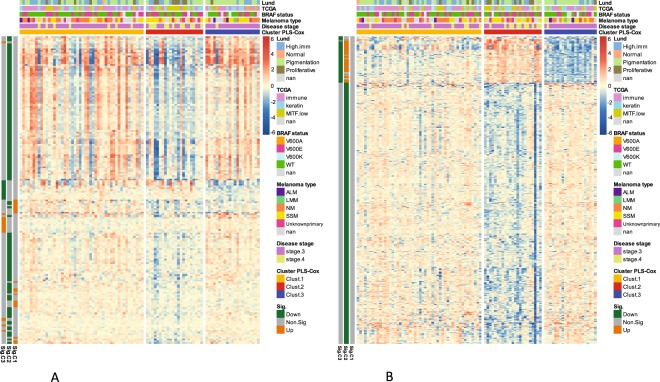
Figure 3.
Proteins and mRNA exhibit differential expression among the survival-related patient clusters. Two-way hierarchical clustering of the transcripts (A) and proteins (B) differentially expressed between the survival-related patient clusters as per SAM analysis. Only highly significant transcripts and proteins shown (q value below 0.0005). Red: high expression. Blue: low expression. Patient clusters coloured as in Fig. 2B. Additional annotations (coloured bars at top) indicate selected patient/sample parameters: Lund genomics cluster23, TCGA genomics cluster, BRAF status, Melanoma type, disease stage. Additional annotations (coloured bars on the left, orange or green) indicate that a given transcript or protein is significantly up- or down regulated for a given cluster.

