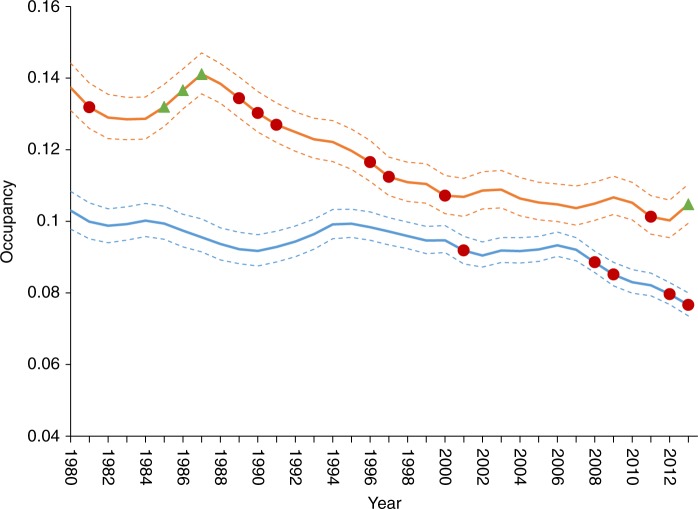
Fig. 2.
Contrasting patterns of change among major groups of pollinating insects. Trend lines show average occupancy of 1 km grid cells in Britain across all modelled bee (n = 139, blue) and hoverfly (n = 214, orange) species. Uncertainty is represented by the 95% credible intervals (delimited by dashed lines). Red circles and green triangles highlight years with notable decreases or increases, respectively. Notable years were defined as those where the upper (decreasing) or lower (increasing) 95% credible interval for the first derivative of occupancy did not span zero (see Supplementary Figure 2)

