Figure 2.
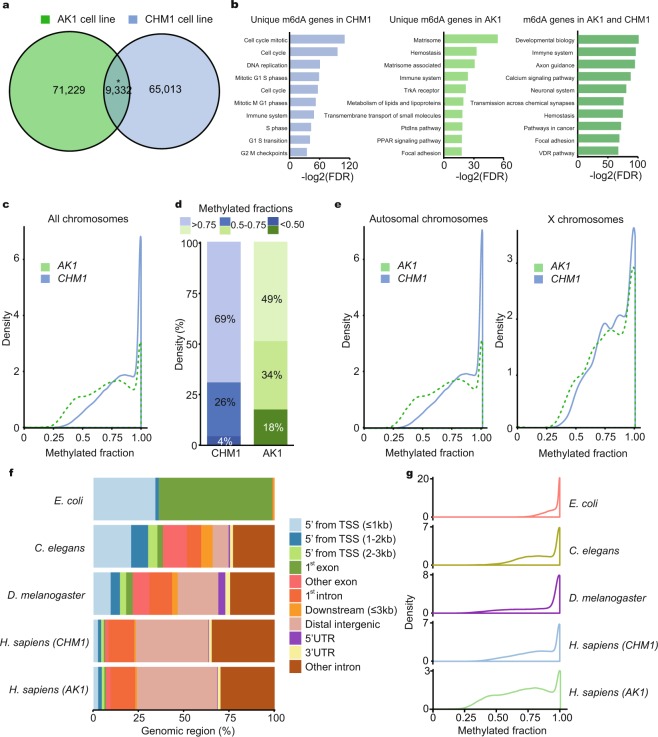
m6dA heterogeneity between different genomes and within cell populations. (a) Number of identified m6dA sites in ( ) CHM1 and (
 ) AK1 cell lines. A significant overlap of precise m6dA nucleotide locations was identified (*P-value < 0.001, Permutation test). (b) Gene pathways that are enriched for m6dA. Pathways unique to m6dA genes in AK1 and CHM1 cell lines are shown, as well as pathways that are associated with genes that show m6dA in both AK1 and CHM1. (FDR) False discovery rate. (c) Density of m6dA methylated fraction. (
 ) CHM1, (
 ) AK1 cell lines. (d) Quantiles of m6dA methylated fraction. (
 ) CHM1, (
 ) AK1 cell lines. (P-value < 2.2 × 10⁻¹⁶, Wilcox test). (e) Density of m6dA methylated fraction, distinguishing autosomal and X chromosomes. (
 ) CHM1, (
 ) AK1 cell lines. (f) m6dA distribution within different genomic regions in different organisms. (TSS) transcriptional start site, (UTR) untranslated regions. (g) Density of m6dA methylated fraction in different organisms.

