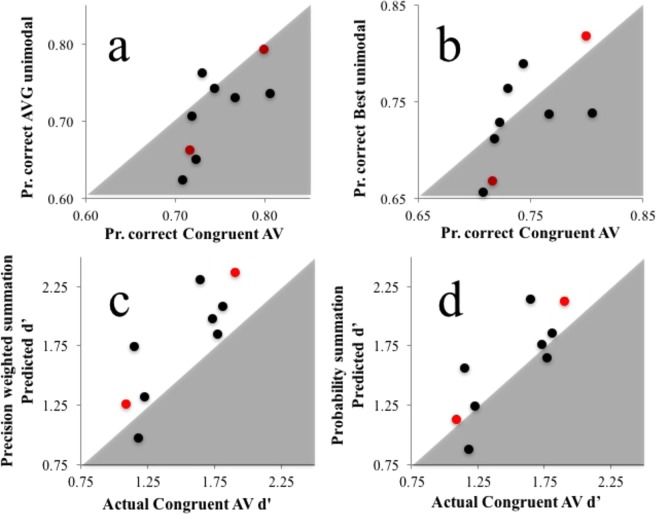
Figure 5.
Data from Experiment 2. (a) X/Y scatterplot of individual proportion correct task performance scores on Congruent AV trials (X axis) and proportion correct scores averaged across each individuals’ unimodal visual and auditory trials (Y axis). (b) As for (a) but for the best of each individuals’ two types of unimodal trials (Y axis). (c) (c) X/Y scatterplot of individual d’ scores for Congruent AV trials (X axis) and d’ scores predicted by a precision weighted summation, from performances on unimodal trials. (d) As for (c), but for d’ scores predicted by probability summation. In all plots author data points are coloured red. Data points in grey regions of (a,b) indicate better performance on Congruent AV trials, relative to the other dataset. Data points in white regions in (c,d) indicate worse performance on congruent AV trials than predicted.

