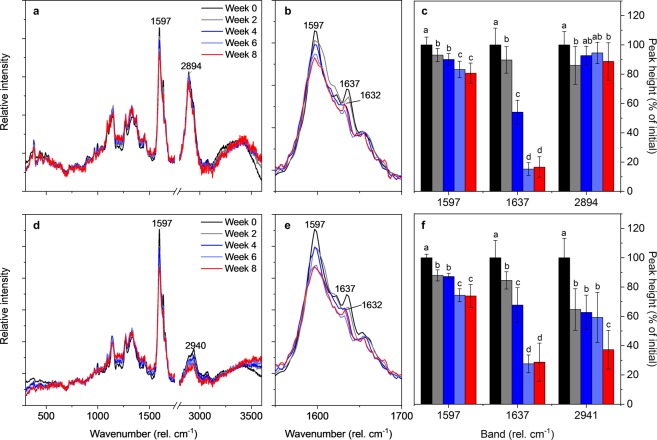
Figure 2.
Average Raman spectra of heartwood degraded by R. placenta. Average Raman spectra extracted from the S2 cell wall (a,b) and cell corner (d,e) regions of Raman images, and the heights of selected bands in the S2 cell wall (c) and cell corner (f) regions. The cell wall spectra corresponding to each time point were extracted from the cell walls of 16 different cells (four cells on four images), while the cell corner spectra were extracted from the cell corners around 12 different cells (three cells on four images). All spectra have been baseline corrected and normalised by total intensity normalisation. Values with different letters in panels c and f are significantly different from one another (Tukey’s HSD test, p < 0.05).

